One of the most reliable leading indicators broke down last week, on Thursday. This implies that the market may move higher for another 2 weeks. We continue to be cautious going in the 2nd half of June. One thing is clear: those predicting an epic market crash last year or this year got it completely wrong.
We follow up on the article we published last week: Enjoy The Party But Watch Out June Won’t Come With A ‘Happy End’:
On the one hand, the number of bulls is rising, too fast, presumably, especially if a debt ceiling deal will be confirmed.
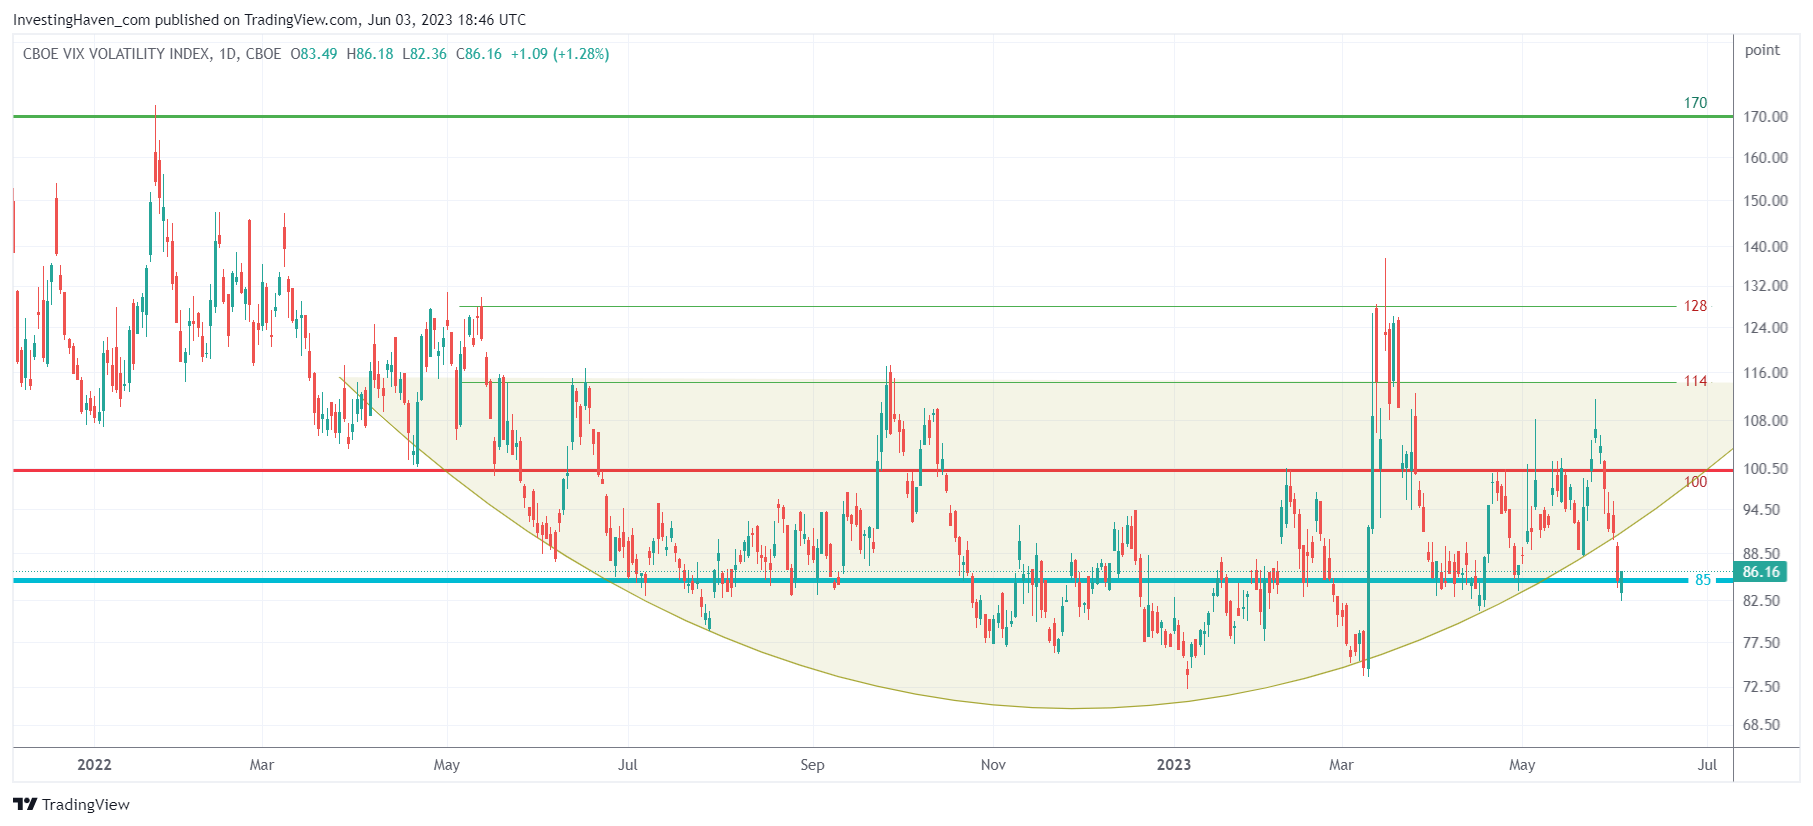
On the other hand, the leading indicator that we trust most, say the leader of all leading indicators, is already working on a turnaround. There is a reason why this is the leader of all leading indicators: it reacts way before the rest of indicators. Below is VIX of VIX, one of the most important charts which we feature every weekend in our Trade Alerts market analysis. Its rounded pattern is bullish, while the Nasdaq may be making a higher high, VIX of VIX is also making a higher low (inversely correlated to stock indexes).
We concluded: “We firmly believe that the end of June will the opposite of early June: higher first in June, much lower in the last days of June.”
What we noticed, in the first 2 days of June, is that the laggards started to catch up. Value stocks were in la-la-land, vulnerable in June, they started to catch up on June 1st and 2nd. That’s good, from the perspective that the end-of-June selling might bring them back to support but not lower! We were concerned about the NYSE Composite Index and Russell2000 index losing support, as explained in This Leading Indicator Loses Bullish Structure, Now Very Vulnerable:
The Russell 2000 chart’s loss of its bullish structure raises concerns about the vulnerability of this index and potentially the broader market. As a leading indicator, its performance offers valuable insights for investors and chartists seeking to navigate the ever-changing market landscape. The breach of the rounded pattern and the prominence of falling trendlines underscore the importance of key support and resistance levels.
We explained, in today’s weekend alert in Trade Alerts, that our favorite leading indicator flashed a positive signal – VIX of VIX came down, broke its 12 months bullish pattern. Remember, volatility indexes are inversely correlated to stock indexes.
While this ‘event’ may sound super bullish, it is more nuanced. This is what we wrote to premium members today:
VIX of VIX expects some more upside potential. The volatility spike is delayed, but risk is not gone. We believe that VIX of VIX is starting to align with our ‘last 10 days of June’ volatility spike. We have some 2 weeks with a bullish bias in SPX, in other words.
Everything is lined up for a drop in the last 10 days of June, which might (could, should) qualify as a ‘buy the dip’ opportunity. No need to feel FOMO’ed until the end of June / first week of July.
More market analysis in our Trade Alerts service. You can also outsource your S&P 500 trades by following our auto-trading service.