The US Dollar has been strong for months now. In March of 2022, its price started a parabolic rise that continued till this month. The price action however has been displaying subtle signs of exhaustion. The chart pattern you will find in this article is not so subtle as it clearly shows there is a shift in momentum. Parabolic moves are not sustainable and once the parabolic trend is broken, the crash is spectacular.
We are looking for turning points, particularly in our Momentum Investing analysis and in the weekend alerts shared to traders in Trade Alerts. As per our 7 Secrets of Successful Investing identifying turning points is, by far, the toughest challenge. The market has to prove us wrong, but until that point we believe we called the turning point in the USD one day before it happened (in our premium research). We work with 107.72 as the ultimate turning point confirmation (only closing prices matter, max 3 consecutive days above it can be allowed).
Daily US Dollar Chart Has A Bearish Formation: Head and Shoulders Setup In Progress
Yes, we have a clear case of a topping pattern forming on the US Dollar chart: A head and shoulders pattern.
In June, we shared with our readers 3 possible paths for the US Dollar based on the chart published in that article:
The first and more likely path is towards a back-test of that $90 support
A breakout above that important $105 resistance, pullback at $110 and if $105 acts as support we can see the price test that $120 area. This will mark the beginning of a new horizontal channel between $105 and $120.
An in-between scenario: the USD price pulls back at $105 where 98-100 acts as support for an undetermined period of time before price clears $105.
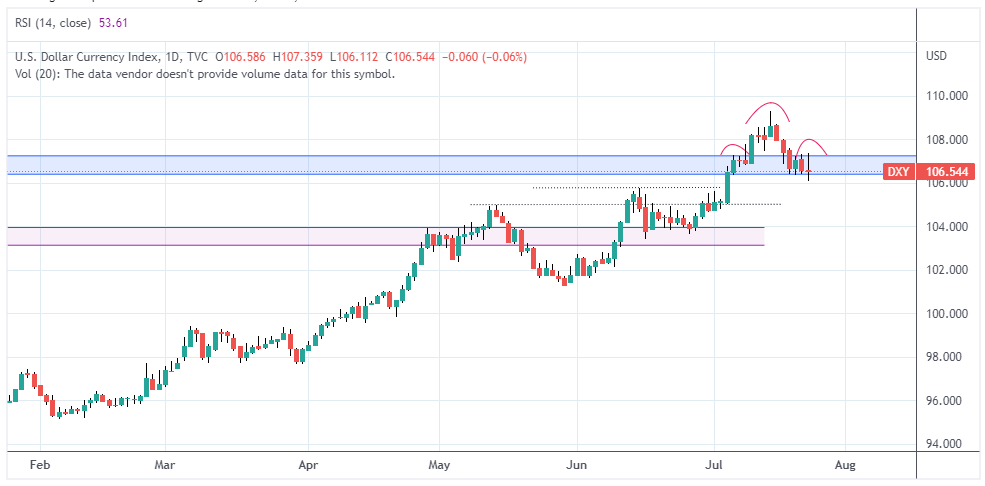
Today, we saw that scenario #2 was the one that unfolded. The priced pulled back at $109.40 (Didn’t even reach $110) on the 14th of July. Since then, the price kept pulling back to a support area: The $106 to $105 area.
The chart below shows that if we break below $106 and there is no bounce at $105, the US dollar will probably keep fading from there. The break below $106 is also a break of the head & shoulders neckline, so the price will definitely head lower.
The head & shoulders pattern is essentially a topping formation. Put simply, after 2 higher highs, the left shoulder is a rejection off of the support or the base that the head had formed. That’s what we are seeing in the chart below.
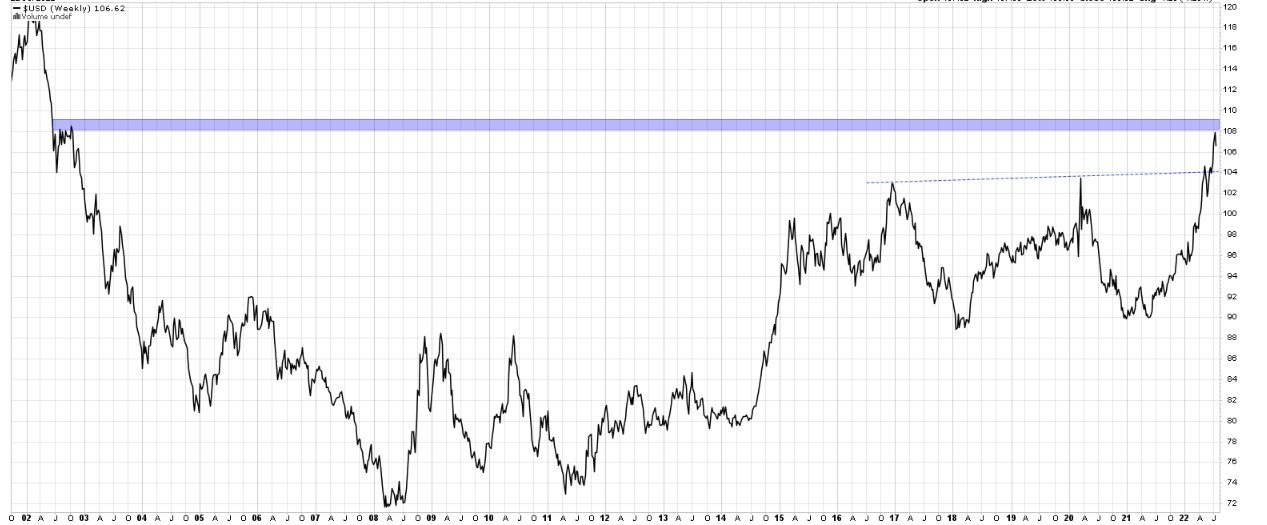
This pullback and possible topping formation is also happening at a historical level as shown in the chart below. Again the chart is pretty straight forward.
Based on the charts above, we believe that the likely path for the USD is lower. If this move materializes, then we can expect a strong performance for Gold, Silver, select Cryptocurrencies and equities in select sectors.
However, we are also seeing many fundamental shifts happening globally as well as on the political front. Any of those could become a wild card that could invalidate the patterns on the charts above or in general. Next week we also have an FOMC meeting and with the most recent CPI numbers, this week will likely be a very volatile one.
Written by hdcharting, reviewed by Taki Tsaklanos


