
Topping patterns on a chart can become pretty fascinating. Think of a very sharp inverted V-shape after a hugely parabolic run up. But there are also long and wide topping patterns like the one that is shaping up in Treasuries at present day. We have seen many topping patterns in our life but the one currently in TLT (20 year Treasuries) is really exceptional. Our forecast is that ‘risk off’ has peaked here, and that it will take a very long time until we see recent fear levels again.
Treasuries are in the end a gauge for risk. Call it a risk barometer.
It’s pretty interesting to see how Treasuries perform over a long period of time.
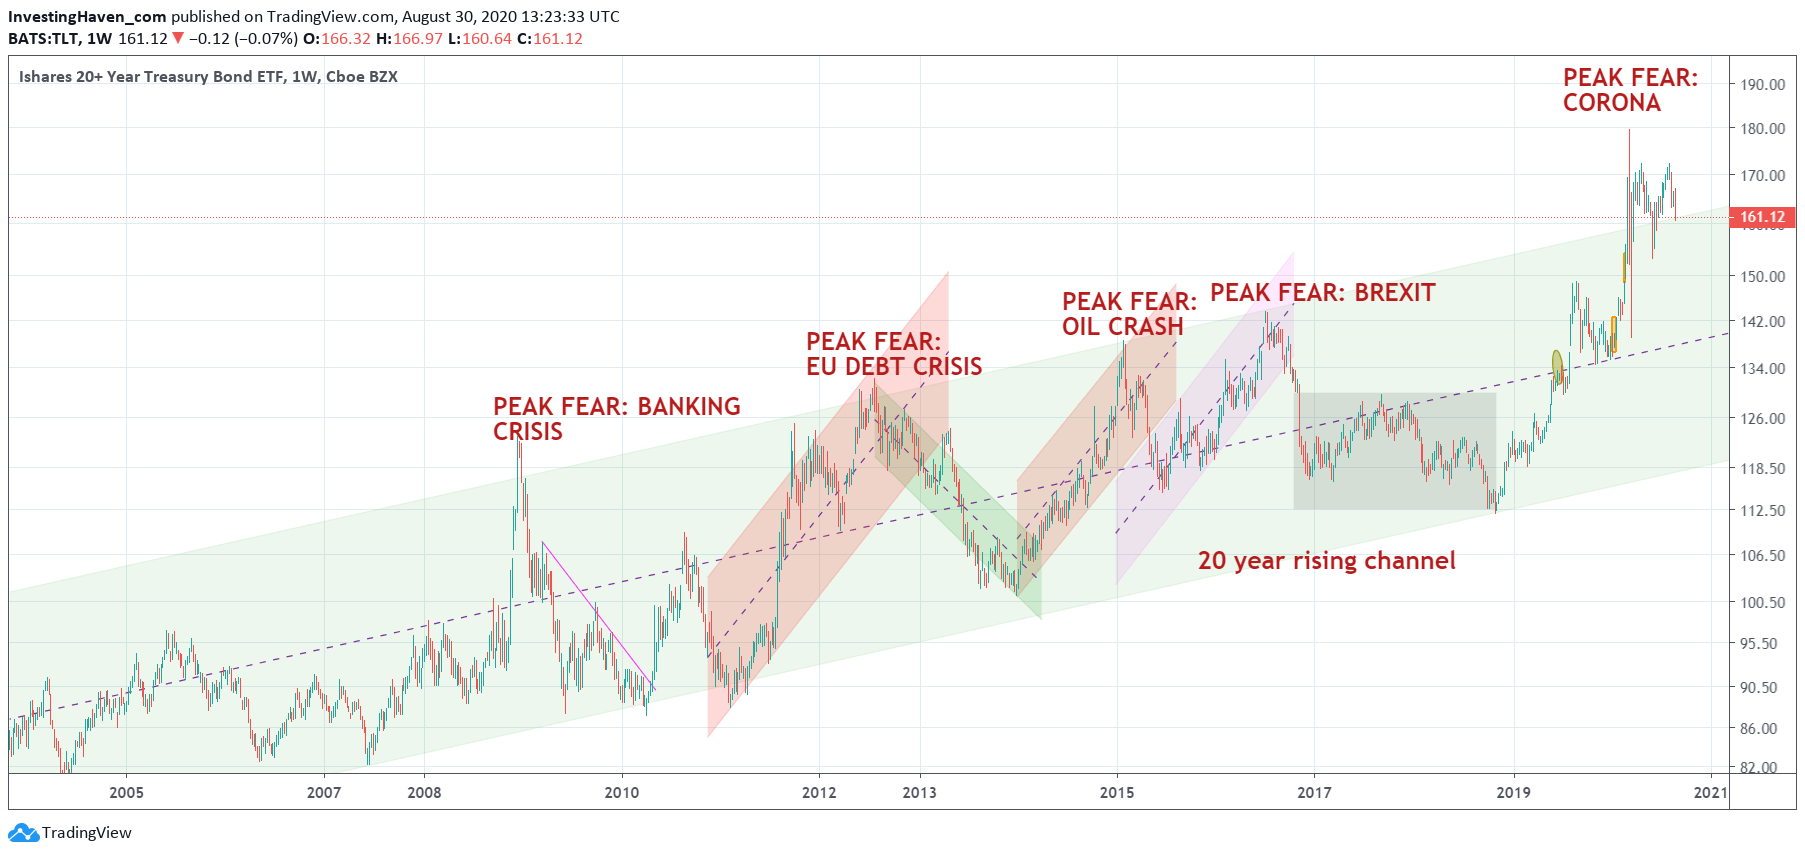
To visualize our point we look at the long term TLT chart. The first chart in this article is the monthly TLT chart.
First and foremost look at the spikes over the last 15 years. What becomes apparent is that the spikes are very sharp since 2009. The last sharp inverted V-topping pattern was registered in 2016, prior to the Corona crash.
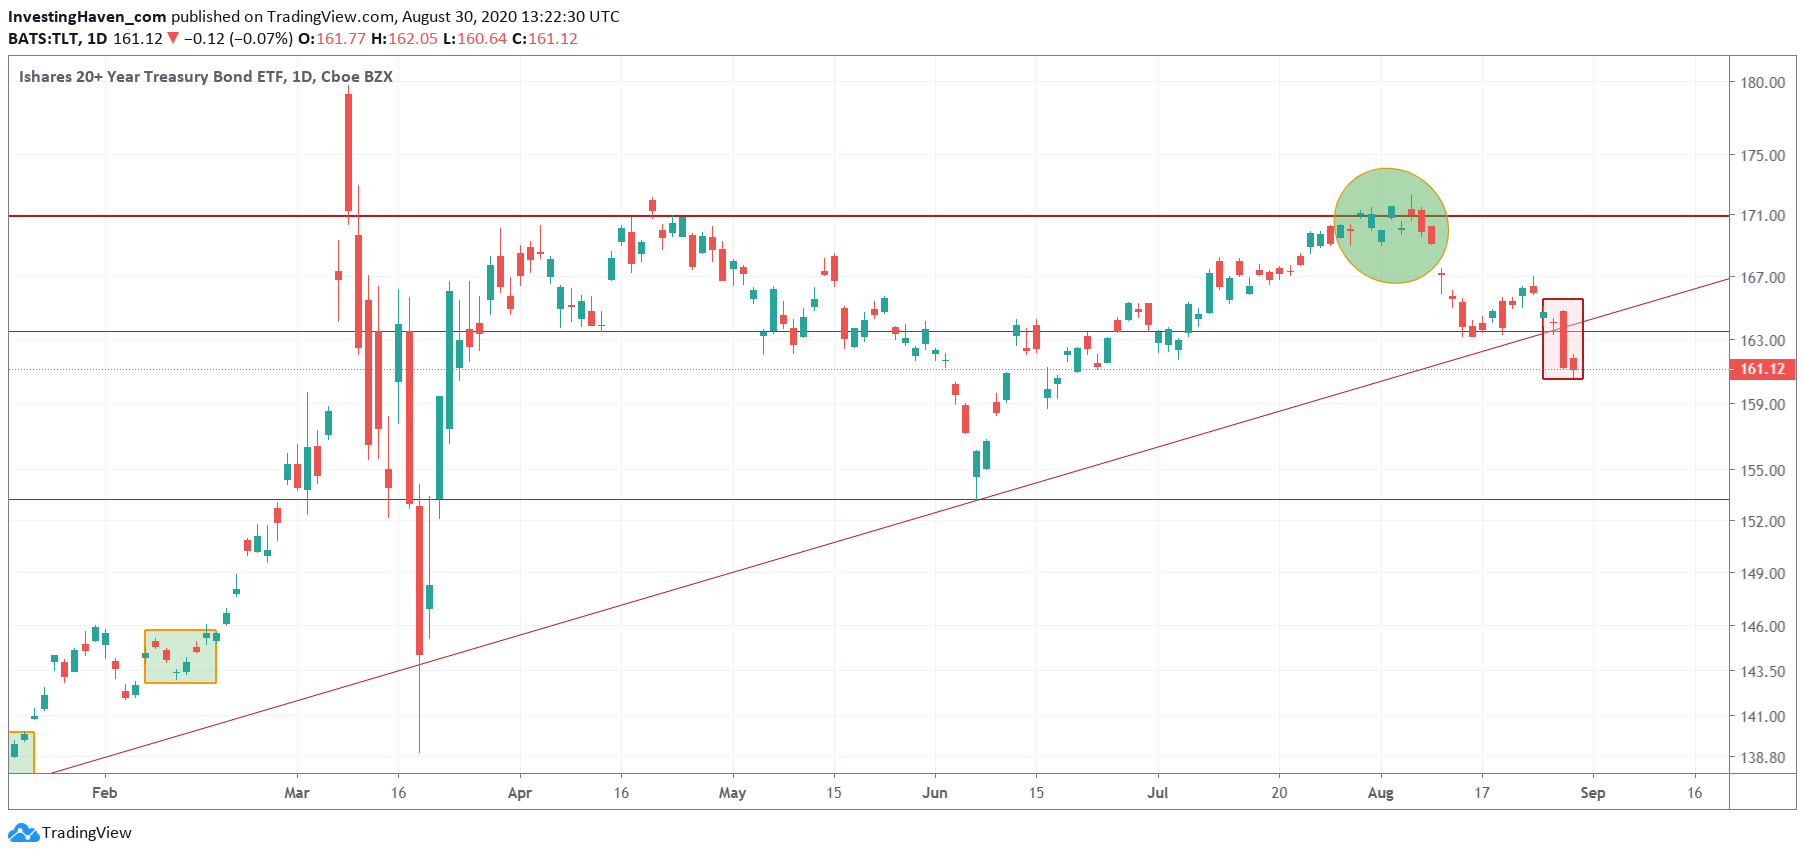
If we zoom in to see what the Corona fear heights look like we see the following setup. Below is the daily TLT chart.
Pretty fascinating isn’t it?
Needless to say we have seen never before in history a setup like the one below. This is a major double top as a topping pattern. It’s huge, it’s fascinating.
The breakdown of last Thursday was pretty crucial. See the red box on the chart.
This topping pattern definitely qualifies as the mother of all tops in Treasuries.
It may even qualify as one of the most fascinating topping patterns in any market.
We believe these charts suggest that ‘risk on‘ is here for a while. This suggests stocks will do well. So the current all time high readings are not the end, on the contrary.
Want to see the trades and investments we do as per our methodology and the charts outlined in ths article? In our Trade Alerts premium service we go after small and larger profits on the very short term, trading the S&P 500 as well as from time to time emerging markets / precious metals prices. Our return was almost +80% in the 6 months of this year. In our Momentum Investing portfolio we go after positions in broad markets, with lots of focus on precious metals, on a medium term timeframe (from a weeks to a few months out). So far, this year, the portfolio is delivering +30%. We are well on track to double our capital in 2020, as per our Mission 2026.


