Nasdaq stocks have been selling of ‘like crazy’ for nearly 4 full months now. While commodities are hot we believe there is a possibility that some tech stocks are worth considering. When everyone is selling, it is smart to watch a turning point to pick up quality with a discount. In the end, as concluded from the Dow Jones 100 year chart, stocks are in a long term uptrend.
Three weeks ago we mentioned that a sell-off was in the making:
As long as 12464 is respected we believe we remain in a long term uptrend. Don’t forget, the ongoing volatility can be part of the long term uptrend. We got a less volatile period in Sept/Oct of 2020, after the first ‘leg higher’ in markets, as seen on below chart. This came with a 2nd ‘leg higher’. Because this index has been rising (higher) for a year (longer) than the first ‘leg higher’ it implies that the subsequent consolidation will be more intense and will take longer (please compare the two grey boxes).
(source: Nasdaq Selling About To Accelerate. What’s Next: Exhaustion Selling Or A Real Crash?)
Right after the invasion we mentioned that the bearish Nasdaq target was achieved:
As per the volatility index chart of the Nasdaq which we featured in our premium services we believe that the downtrend may be coming to an end now. The volatility index chart suggests that a consolidation, presumably a very volatile consolidation (in both directions), is in progress now. What’s important, as of next week, is to closely watch how the Nasdaq will ‘behave’ on weakness. Readings above 13600 for the entire day, especially daily closing prices, would suggest that a turning point is in the making. However, below 13600 (3 day closing basis) as well as a breach of the 12959-12464 area would be horrible news for stock market bulls!
(source: Nasdaq: Bearish Target Achieved, Now It’s Time To Carefully Observe The Bounce)
So far so good, but what’s next. This is what we wrote in our Momentum Investing weekend analysis today:
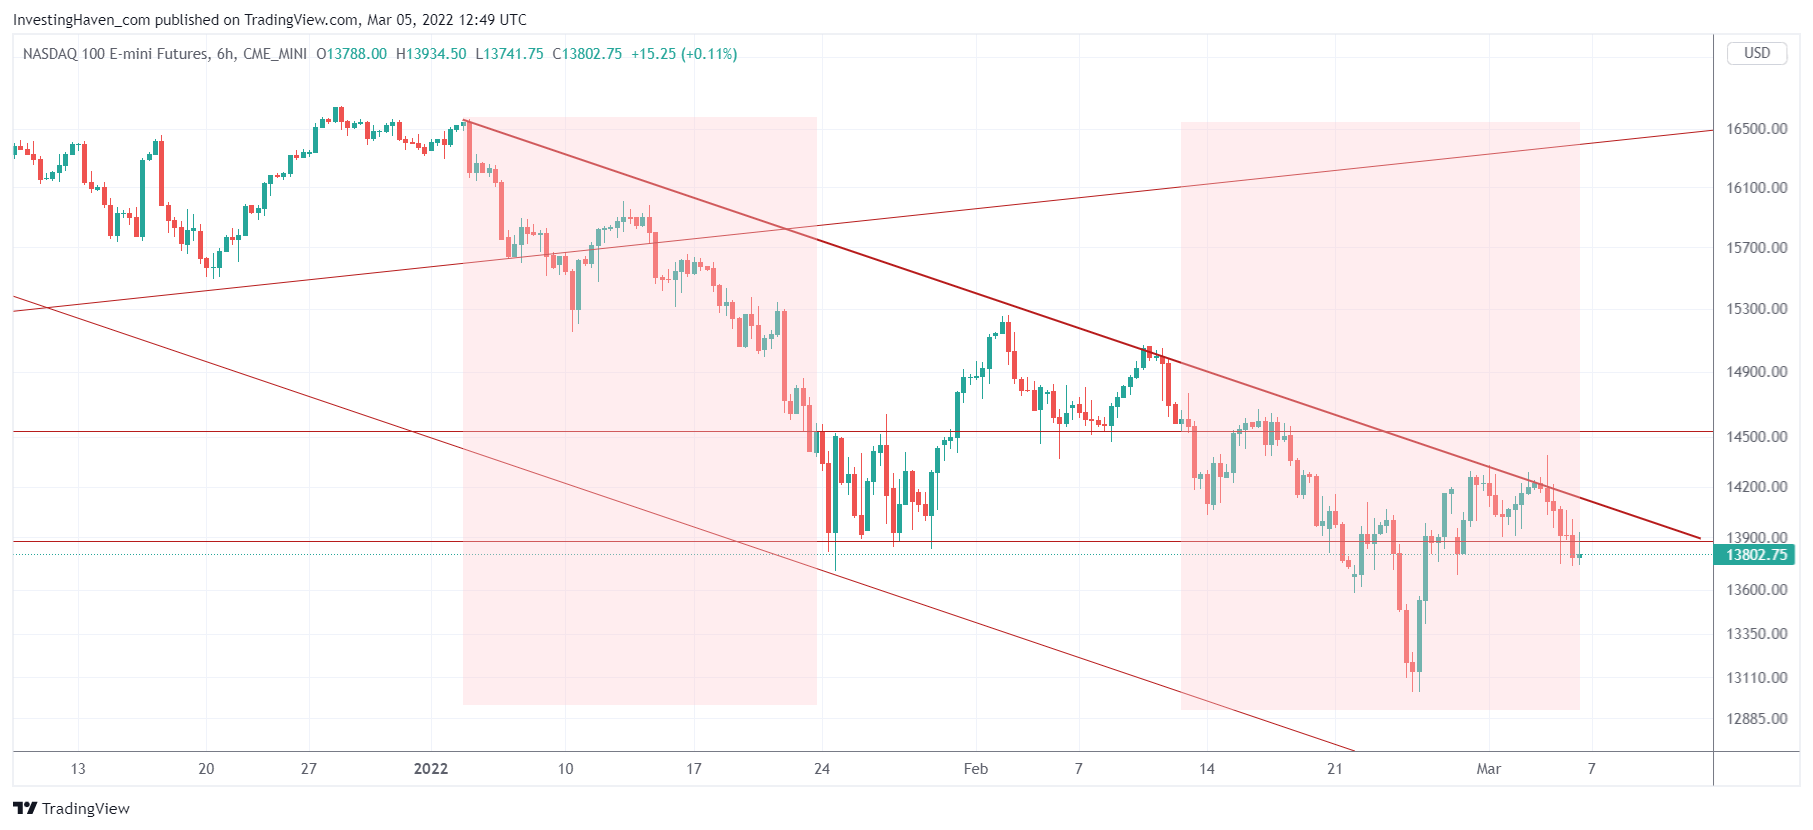
As said many times, this ongoing 3 month cycle is an extremely difficult read as it consists of an unusual series of 3 week mini cycles: 3 bearish weeks from Jan 4th till 24th, 3 weeks of relief, 3 bearish weeks which should come to an end tomorrow (March 7th). What will the next 3 week cycle bring: relief normally, but also when a war is raging? The 3 bearish week periods are represented by the red shaded area.
Below chart suggests that IF a bounce will start it should start in the next few days. Moreover, IF this bounce comes, as per the mini-cycles in the context of the current 3 month cycle, it would mark a breakout of the downtrend.
The next few days will be decisive for the Nasdaq index.
Many tech stocks will need a lot of time to recover as the damage has been enormous. However, a select few sectors look really good. In our Momentum Investing portfolio we opened a position in a very promising tech stock which has amazing fundamentals and financials. Moreover, in our automated trading services in which we trade the S&P 500 for our members we have accumulated several profits which largely outweigh the few losses in recent months, largely outperforming our peers and indexes.