The US Dollar is in good shape lately. It has risen 7% since May, and close to 2% in the month of August. The Dollar is now at a crucial level, and what happens from here on may have serious impact on gold, silver and China’s stock market in 2018.
Why do we care about the US Dollar? We are not FX traders, InvestingHaven has no foreign exchange analysts. The answer is very simple: intermarket dynamics. It is because the US Dollar is such an important asset that its trend(s) strongly impact other markets, the ones that we are very interested in, for instance stock markets, gold, silver, other commodities.
Note, this only applies in instances where the US Dollar has trended strongly, either a strong rally or a strong fall. We are talking at least 15% in a matter of months.
In other words, the US Dollar, once it breaks out or breaks down strongly, has the tendency to become a leading indicator for other markets like stock markets, commodities like gold and silver. That’s especially important because gold, silver, and China’s Shanghai Composite stock market index are all trading near major breakdown levels.
Nex trend of the US Dollar? What does it mean for gold, silver, China in 2018?
In order to answer this question we turn our attention to the daily and weekly charts of the US Dollar.
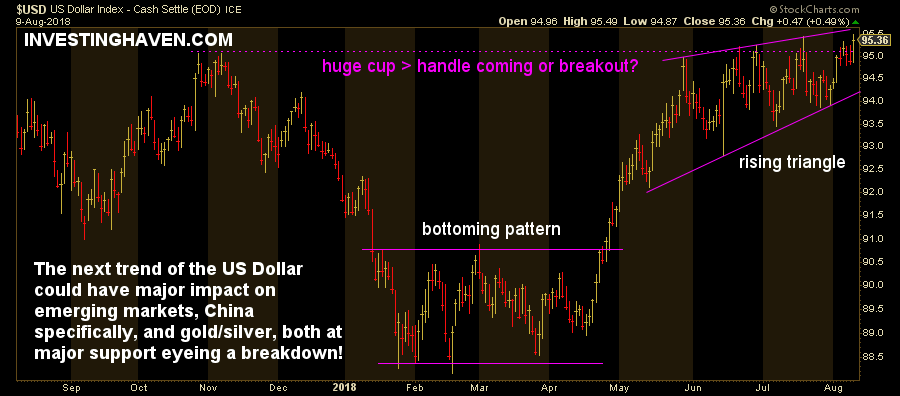
The daily, first chart below, has an extremely interesting pattern. After a strong correction between November last year and January 2018, there was a classic bottoming pattern in a tight range for 3 months. It resolved into a breakout in May 2018.
Since mid May we observe a rising pattern which is bullish in nature, in the short term.
However, all this happens in the context of some sort of large W formation. One can also argue there is a huge cup shaping up.
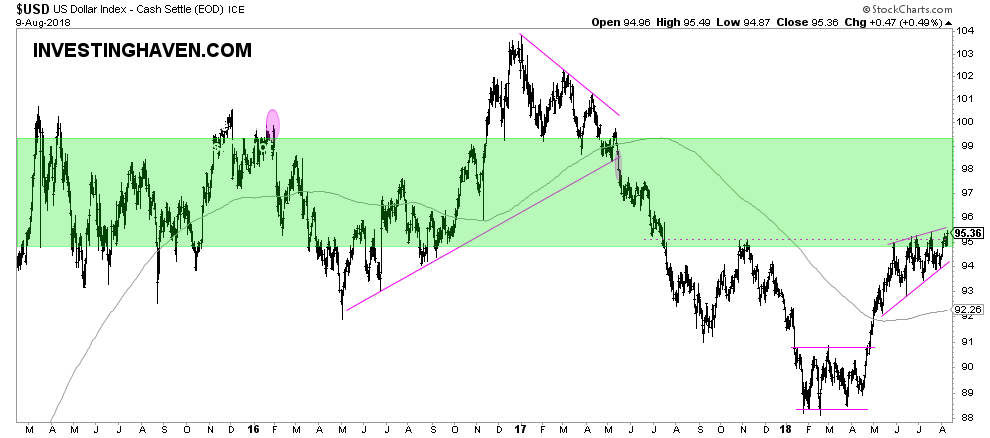
So in order to get an idea of the next trend in the US Dollar we have to zoom out, see the weekly chart below.
The weekly US Dollar chart gives a much broader view. Essentially, between 2015 and 2017, the Dollar has traded most of the time in this green sideways channel. It moved out of it in 2017 for a couple of months, and remained below it since mid-2017.
Arguably, after such a strong correction we may not see a very bullish trend in such a short timespan. So the most likely path of the Dollar is to stay neutral in the green area.
However, on the flipside of it, the recent rise since May is shaping up in a bullish pattern. The Dollar tends to change fast, and patterns on its chart shape up fast as well. A breakout might be in the cards given the setup between June and today.
We watch very closely what happens at its breakout point which is 96 points, and that’s exactly at current levels.