Open Text, a software stock with a market cap of $10B, has an amazing growth track record. This occurred especially in the last decade. Open Text has successfully moved into the cloud business. It established $2B recurring revenue per year, successfully acquired several companies, and has an amazing profit margin. With this in mind what is our Open Text stock forecast for 2019? Is this stock worth buying as it trades at all-time highs?
Open Text stock forecast: start with the chart
As per InvestingHaven’s ‘start with chart’ principle any forecast starts and ends with the chart.
The guiding principle, in any stock forecast, is that the daily, weekly and monthly charts need to be in line with each other. If there is any divergence in terms of patterns or trends the reliability of every forecast diminishes considerably.
Open Text, interestingly, is a classic case in which the different timeframes confirm, and even complement, each other. The weekly chart confirms the big picture trend on the monthly, and provides more color to it. In other words, weekly and monthly charts are in synch, and the reliability of our forecast is high because of this.
An Open Text stock forecast for 2019 based on its chart
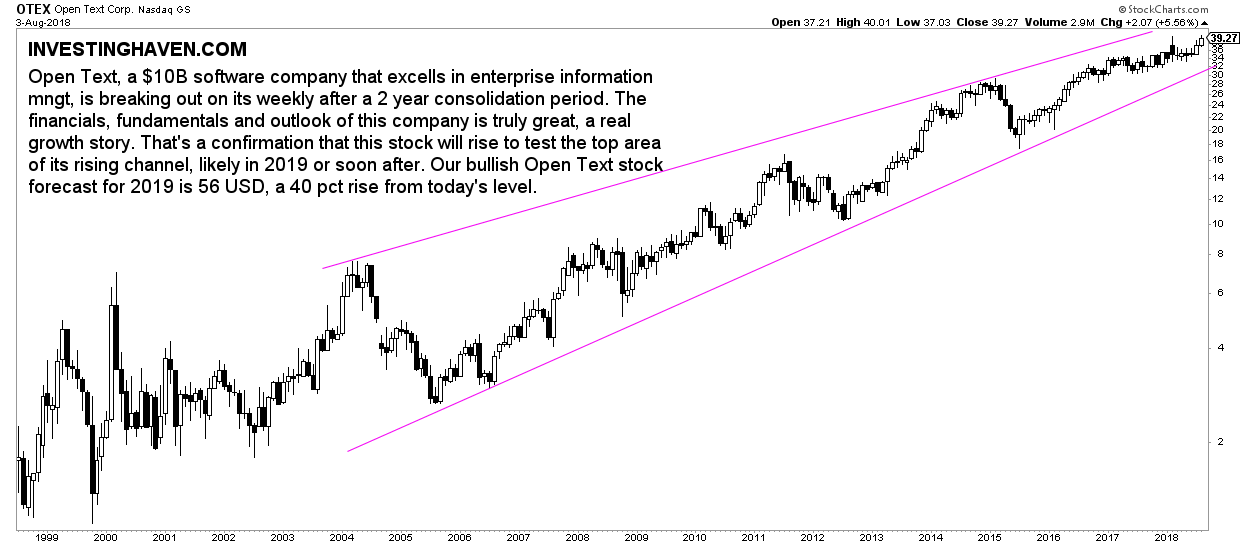
The monthly chart shows a clear and outspoken pattern. There is no clutter, no blended pattern, no confusion, at all.
The long term rising narrowing channel is a bullish setup until Open Text comes close to its apex. We are a couple of years away from that point.
Given the current pace of its rise we observe that Open Text’s stock forecast for 2019 will be 56 USD provided it will trade, at a certain point, close to the upper area of its rising channel. Moreover, we exclude a market crash as it would delay any rise in any stock.
Note: this is a 40 pct rise compared to the price at the time of publishing this article. Admittedly, this is a bullish stock forecast for 2019, so we need to ensure that the weekly chart as well as fundamentals and financials line up for this forecast! Please continue reading.
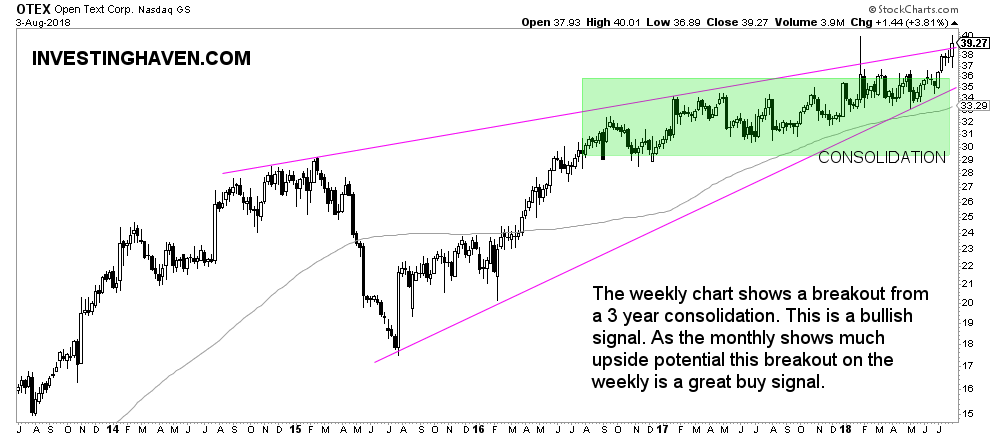
The weekly chart provides much more color to the trend on the monthly. There is a clear consolidation in the last 2 years, indicated in green on below chart. Open Text broke out from its consolidation area recently. Note how it is a double breakout: it breaks out of its horizontal consolidation pattern as well as its triangle pattern.
The weekly chart confirms the trend on the monthly chart. That is great.
So are we done? No, there is more to it. In our attempt to understand the Open Text stock forecast for 2019 we need to be sure that fundamentals and financials of the stock validate the 40 pct rise in the stock price.
Open Text financials in 2018
Open Text announced its quarterly results this year as well as its annual results. Their fiscal year ended at the end of June. This is what stands out to us (source: investor relations website and Finviz Open Source financials):
- Q4 was a strong close to a record year, with $2.8 billion in total annual revenues and 23% year over year growth.
- OpenText’s Annual Recurring Revenue business grew 22% year over year to over $2 billion with the expansion of support, cloud, business networks and security product lines.
- Their cloud business grew 16.8% year-on-year, their support business 21.8% in the same time period. There is a clear growth catalyst that makes up for the declining licence revenues, a challenge that every software business is facing and that only the smart companies overcome in a successful way.
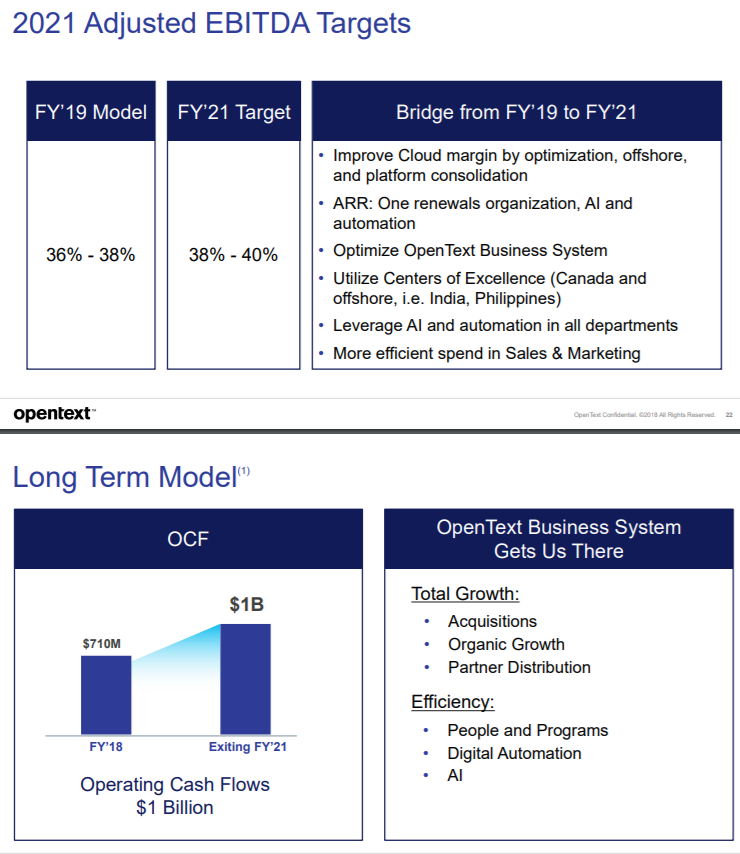
- In Fiscal 2018 the company generated over $1 billion of adjusted EBITDA and $710 million in Operating Cash Flows, which was up 62% over the prior fiscal year.
These are strong results, and confirm a bullish stock forecast for 2019 provided that the outlook and fundamentals are great.
Open Text fundamentals and outlook for 2019
The last step is to get a confirmation of the fundamentals of the company which is essentially the business outlook for 2019.
As per the transcript of the annual earnings call of the company:
We have successfully transitioned the business to an annual recurring revenue model. Year-over-year growth related to acquisitions was 17.5% or 17.2% in constant currency. Further, we allocated $321 million in capital to acquire Covisint, Guidance, and Hightail during the fiscal year. Year-over-year organic growth was 5.5% or 2.5% in constant currency. We delivered over $1 billion in adjusted EBITDA or 36% of total revenues, with 29% year-over-year growth.
We expect adjusted EBITDA to be between 36% and 38%; operating in the mid-to high-30s is ideal performance for a large software business such as OpenText and our large software peers.
Moreover, we find this quote in the quarterly results:
We have strong software and support sales, a solid recurring revenue business, a healthy balance sheet for continued M&A and organic growth, and new products in cloud, security, business networks, content services and analytics and AI. OpenText has a world-class leadership team that is second to none. We’ve also doubled down on global partnerships that move our business forward with uncompromised value to customers. Year-over-year, we’ve demonstrated the sustainability and scalability of our business and our steady progress.
Moreover, the investor deck shows these targets for 2021. The company published a disclosure that these figures are not meant to be interpreted as a stock price forecast. However, for the purpose of our Open Text stock forecast for 2019 we used them as a datapoint in our method. We use this outlook to confirm whether the ongoing dominant pattern on the chart will continue or not.
Open Text stock forecast for 2019 of 56 USD?
The outlook (fundamentals) of the company is in line with recent financials. They both confirm the observations on the monthly and weekly charts. That is why we believe that the dominant pattern will continue, and will bring Open Text to 56 USD at a certain point in 2019 or somehow later.


