
One of our 2022 market forecasts is that stock markets should continue to do well, we concluded this from our Dow 100 year chart analysis. No market crash yet, but volatile periods and maybe a short lived flash crash. Moreover, we expect both gold and silver to have (at least) one bullish cycle. Green battery metals should continue to be the outperformers, we have a lot of trust in our bullish lithium, graphite, cobalt forecasts. All this is a set of expectations in a 12 month time period, but what about the next few months?
The next few months will not be easy, is our understanding based on the charts we feature in this article. We expect volatility to pick up in Q1/2022. Combined with a largely trendless state we only see limited opportunities. However, they should be there, and it might be as soon as the first weeks of January (maybe capped as of the 3d week of January).
First quarter of 2022: broad market direction
We expect opportunity but also challenge in 2022, and our market readings suggest that we can expect both in the first quarter.
The challenge are visible in a few leading indicators, we tend to call them ‘pushback indicators’ or ‘crash indicators’ and we cover them extensively in our Momentum Investing service.
Volatility index VIX is creating a solid structure around the 20ies. This suggests that volatility is picking up. The volatility ‘outbursts’ we got in December are set to repeat in Q1/2022.
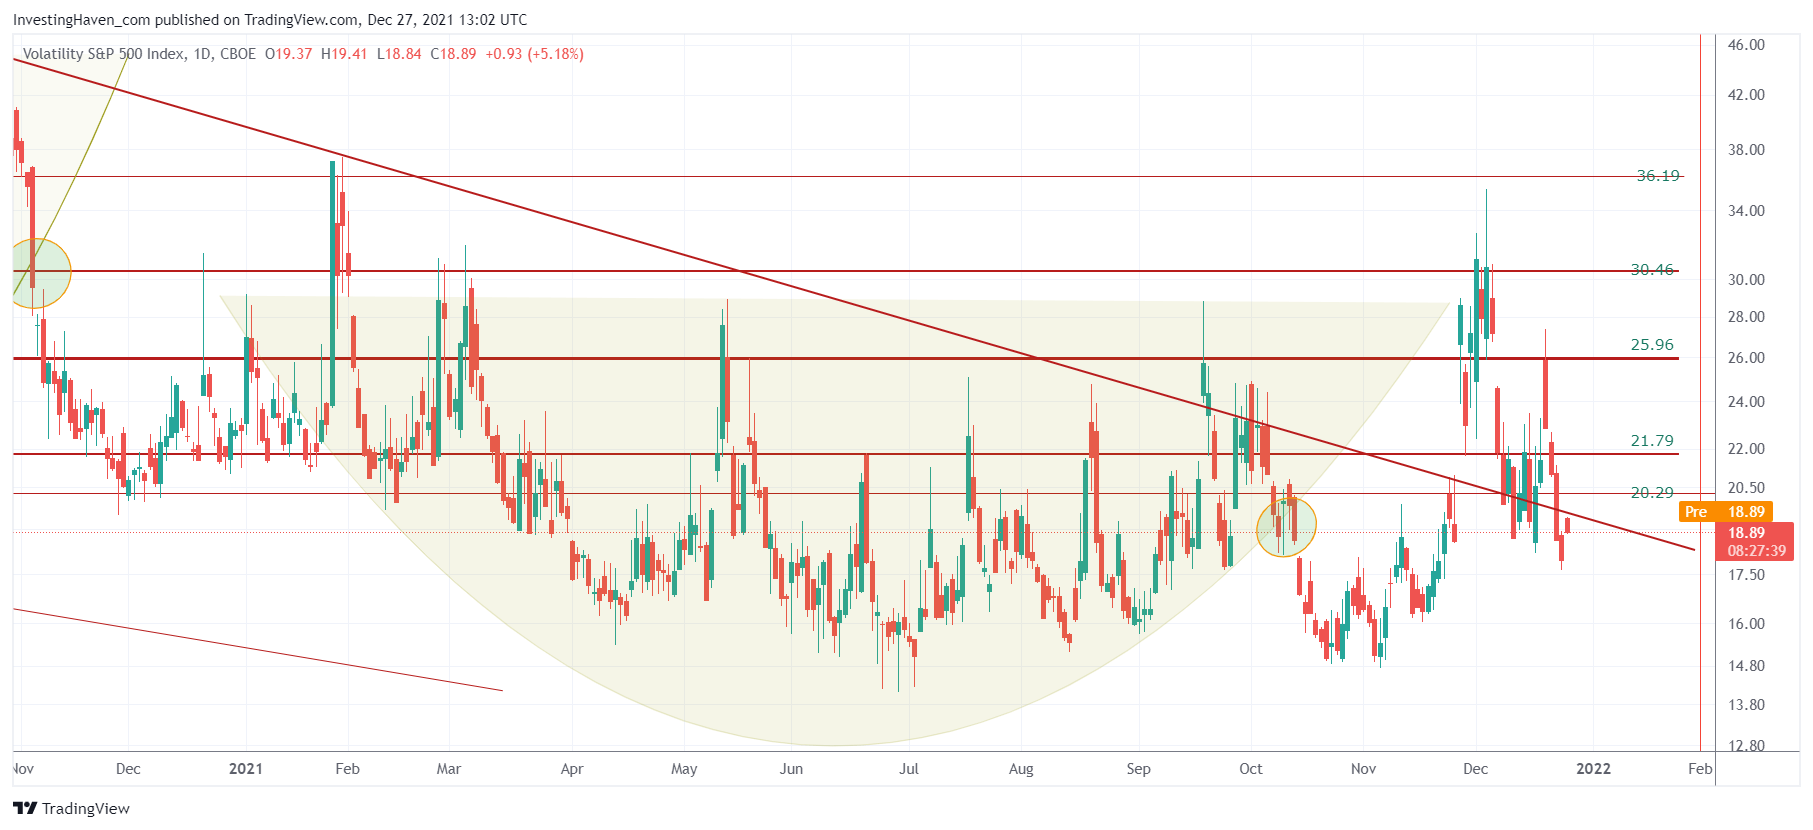
Although not featured in this article we track a variant of the VIX index. It is a chart that is very complex to analyze. It suggests that February 1st might get really nasty.
Moreover, from a timeline perspective, in analyzing market cycles, we see this pattern since last summer:
- August: bullish (a 3 week bull run)
- September: bearish
- October: bullish (2nd week of Oct till 1st week of Nov, a 3 week bull run)
- November: flat to bearish
- December: bearish with a possible ‘happy end’
Can you see the pattern? Two short lived bull runs in the last 5 months. That’s not a lot, is it. Moreover, the bull runs tend to last 3 weeks (there you have the number THREE again).
The above indicator suggests that this pattern is here to stay, for a while.
This is also confirmed in the USD chart: a wildly bullish setup that is taking a short break here. The USD is clearly on a mission, and its mission is 98 to 100 points. The current (short?) break may open the door for another 3 week bull run (in January, presumably) after which we expect the USD to continue to move higher unless it breaks below 95.50 points.
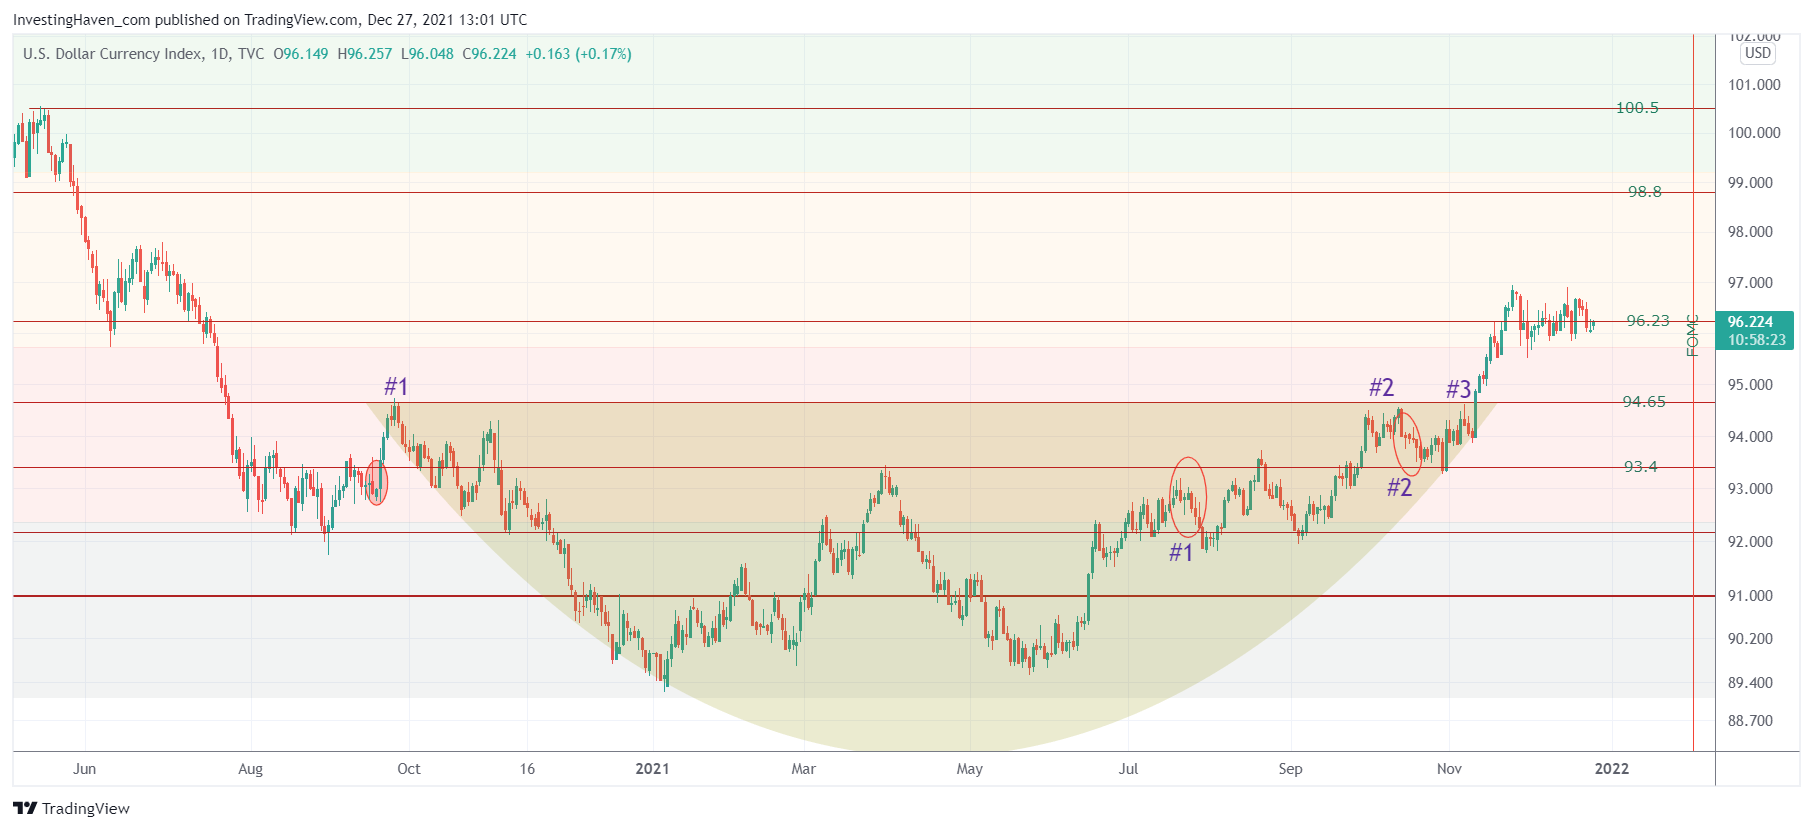
You might say ‘what’s the fuzz with the USD, am not interested trading forex, why worry’? The point is this: the USD is a leading indicator, and when it is rising it suggests that investors are accumulating cash. While we are not interested in forex trading, we do consider the USD as an indicator that capital is flowing out of risk assets.
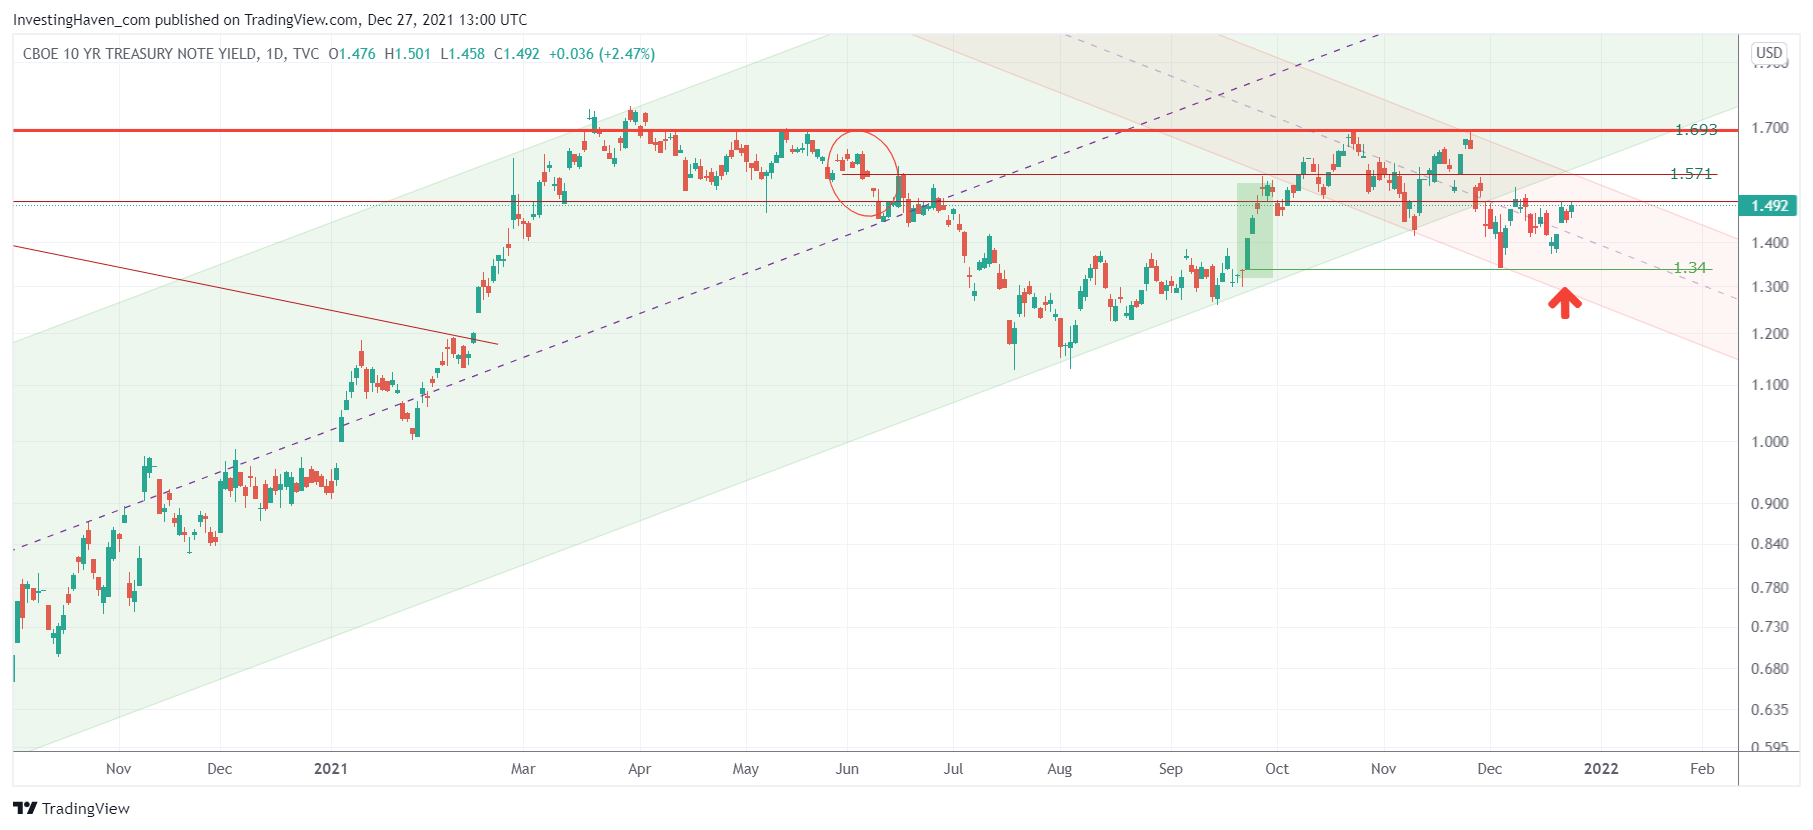
Another similar market we closely monitor, and talk about extensively in the weekend updates in our premium services, is 10 year bond yields (TNX). No, we are not interested in Treasuries as a market to invest in. We are really interested in understanding momentum trends, and TNX creates momentum whenever it rises (bullish momentum for stocks) or falls (bearish momentum).
Since Thanksgiving, we can clearly see that TNX is range bound. No surprise, there was no bullish momentum in stock markets (only bearish momentum). Stocks will be wildly bullish once TNX clear 1.69 and wildly bearish once TNX falls below 1.34. We will be closely watching the trend on the TNX chart as we head into February. Our best guess is that we can see some short lived momentum in January (TNX moving to the 1.6 area), after which TNX will go back to 1.34 where it will undergo a crucial test.
Here is the nightmare scenario for most investors: TNX remains stuck in a wide range between 1.3 and 1.6 with VIX refusing to fall below 18 points. This will bring volatile but trendless markets. Most investors will get nervous and start over-trading.
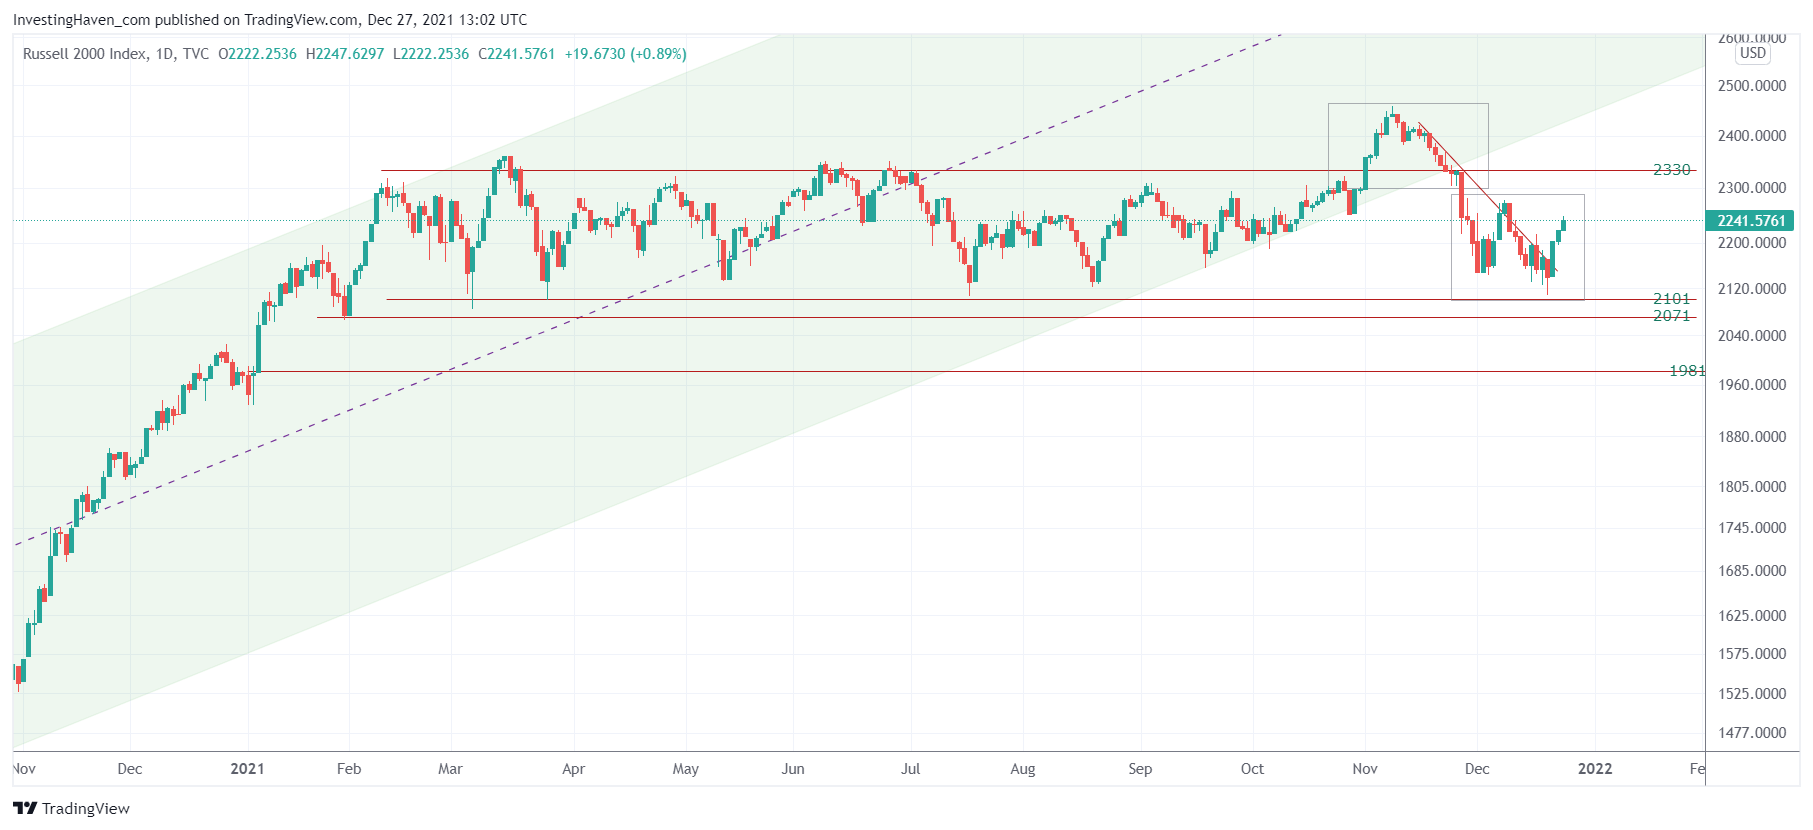
We have been talking, repeatedly, about the 2101 level in the Russell 2000, another leading indicator in our methodology. Our best guess is that volatility will challenge the 2101 level, and a violation might push the index to 1980 points. Ultimately, the Russell 2000 might go back to 1700 points, in 2022, unless it will break out above 2400 points (in which case 1700 will be a real crash scenario which we don’t expect yet in 2022 but in 2023 to start).
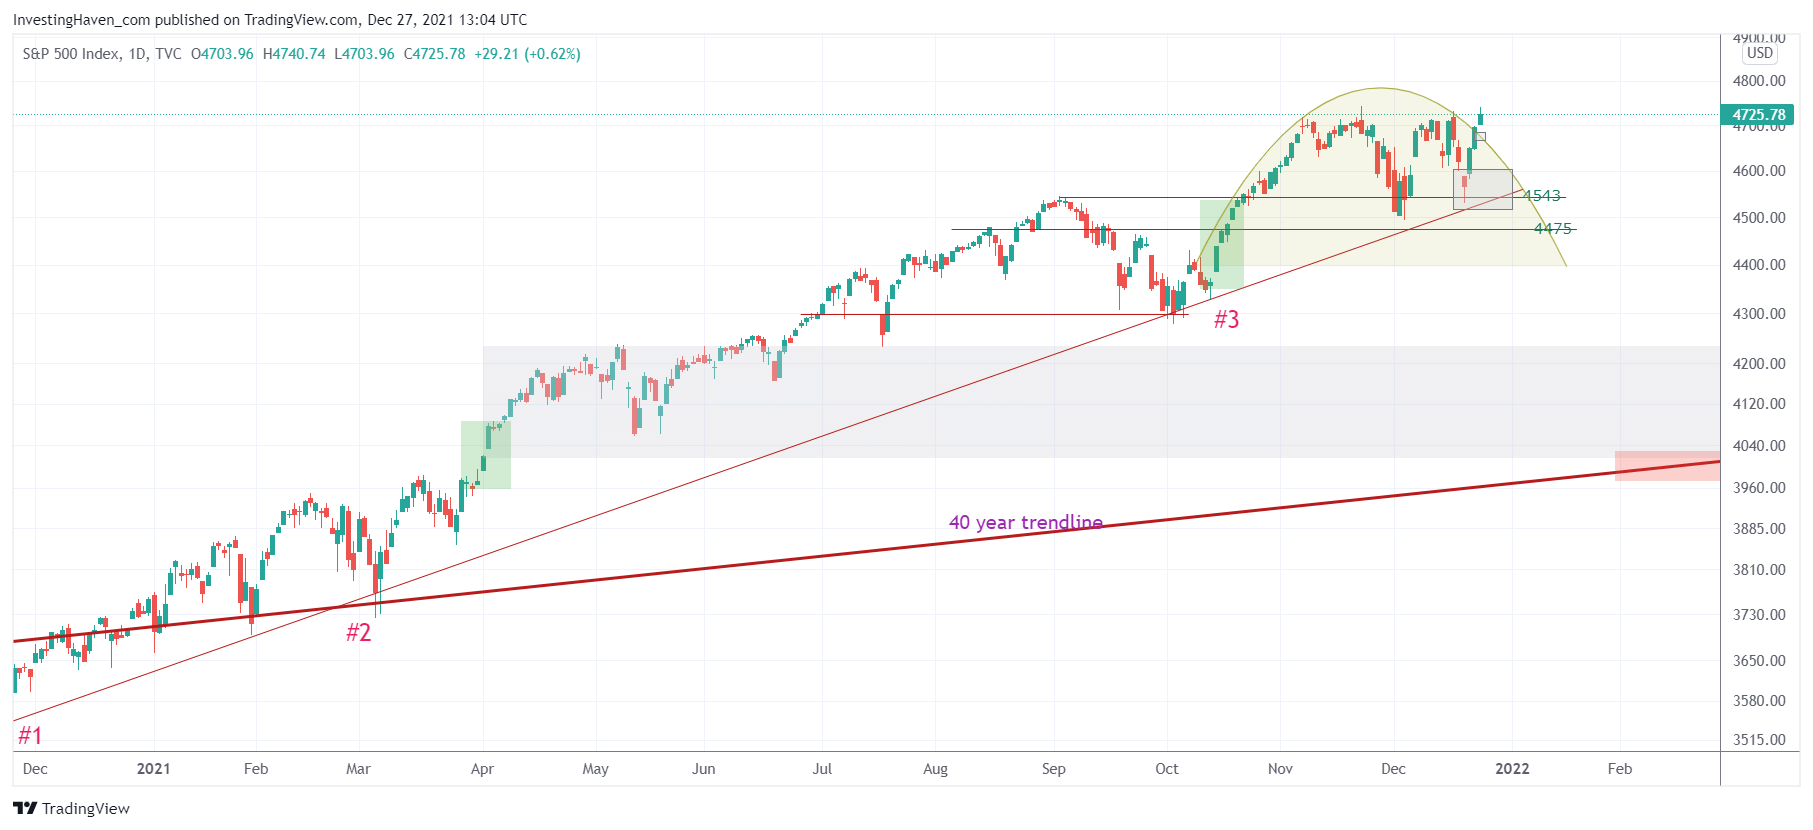
The S&P 500, as a leading index, is right now in the process of ‘breaking up’. It is bullish short term. However, as you can see, the 12 month bullish trendline was tested 3 times since last November. Our best guess is that the 4th test will come with a breakdown. Our downside targets are indicated with the green shaded areas, and we got them from our candlestick analysis. The most obvious downside target will be 4350 points, the most bearish target of 4050 points might be hit but only if our ‘crash indicators’ start flashing RISK OFF.
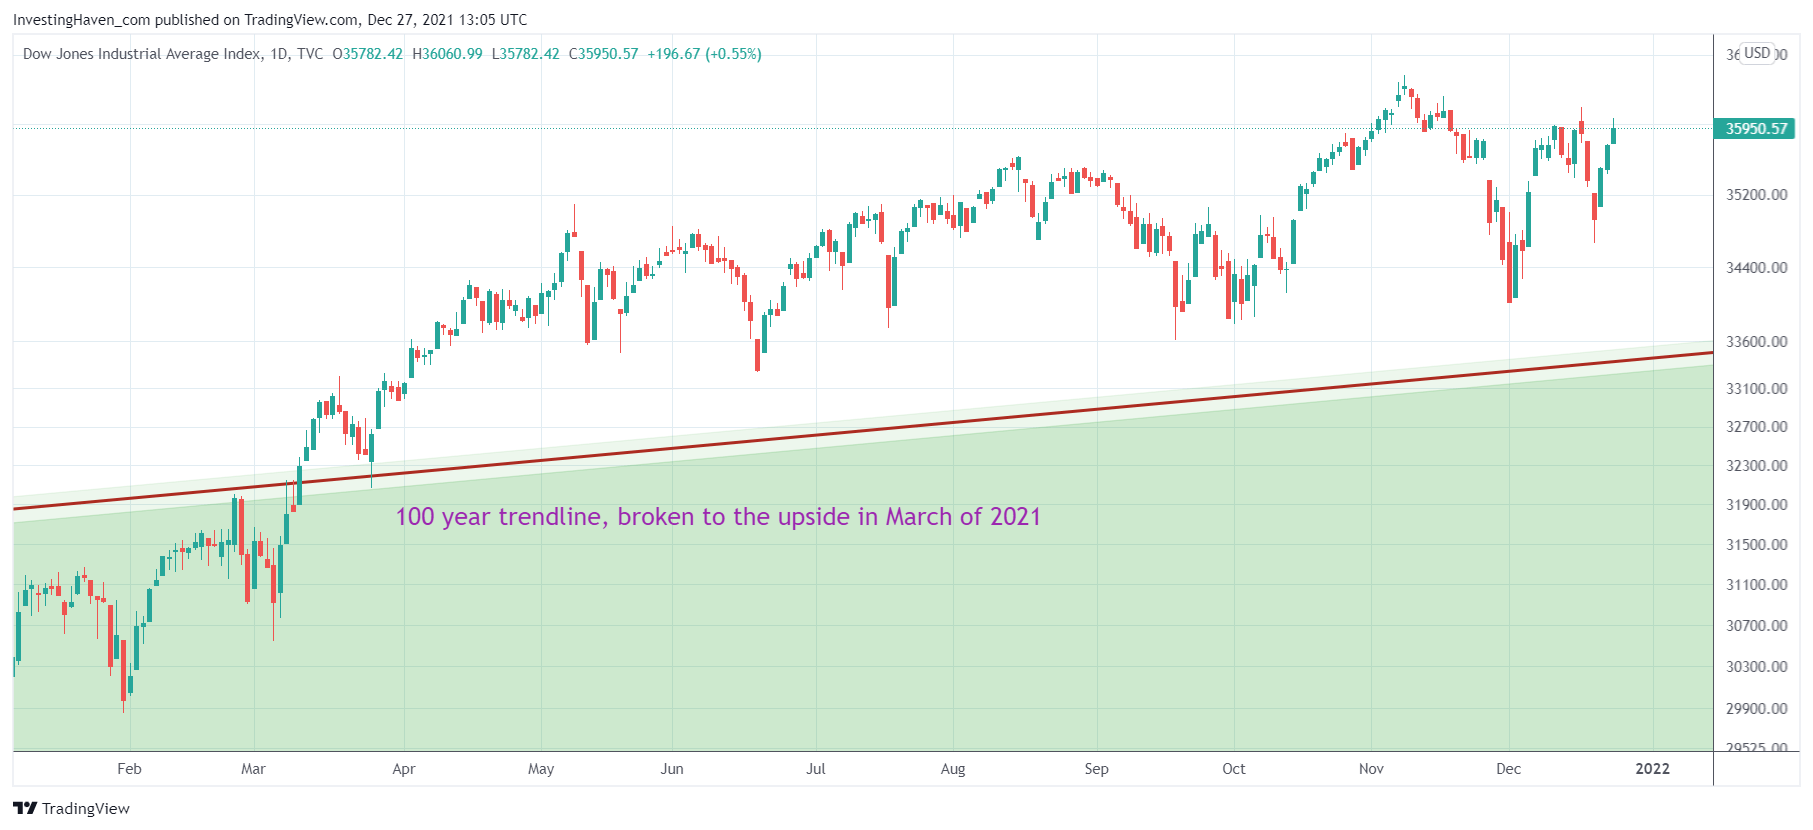
Although we expect Q1/2022 to be volatile and selling to pick up as of February 1st, we don’t expect a market crash. That’s because stocks are still in a wildly bullish area, hard to believe but true. Our Dow Jones long term chart analysis has this breakout above a 100 year trendline in March of 2021. It is this same trendline that was resistance in 1929, 2000 and 2007. All of them marked the start of an epic crash, THIS TIME IS DIFFERENT, visibly.
In sum, this market is still supportive of rising stock indexes. Volatility is picking up, the USD is not done rising, momentum indicators like TNX suggest a sideways trend with swings up and down.
Moreover, our proprietary volatility analysis suggested that February 1st will be a crucial period in which volatility might be explosive (short lived potentially).
Our best guess is that we are, right now, entering a 3 week mini-bull run after which selling might accelerate (going into February 1st).
First quarter of 2022: Opportunities
Are there any opportunities in January and March/April, is the million dollar question?
We believe the answer is YES, but timing entries and exits will be crucial. Moreover, being ultra selective will be even more crucial.
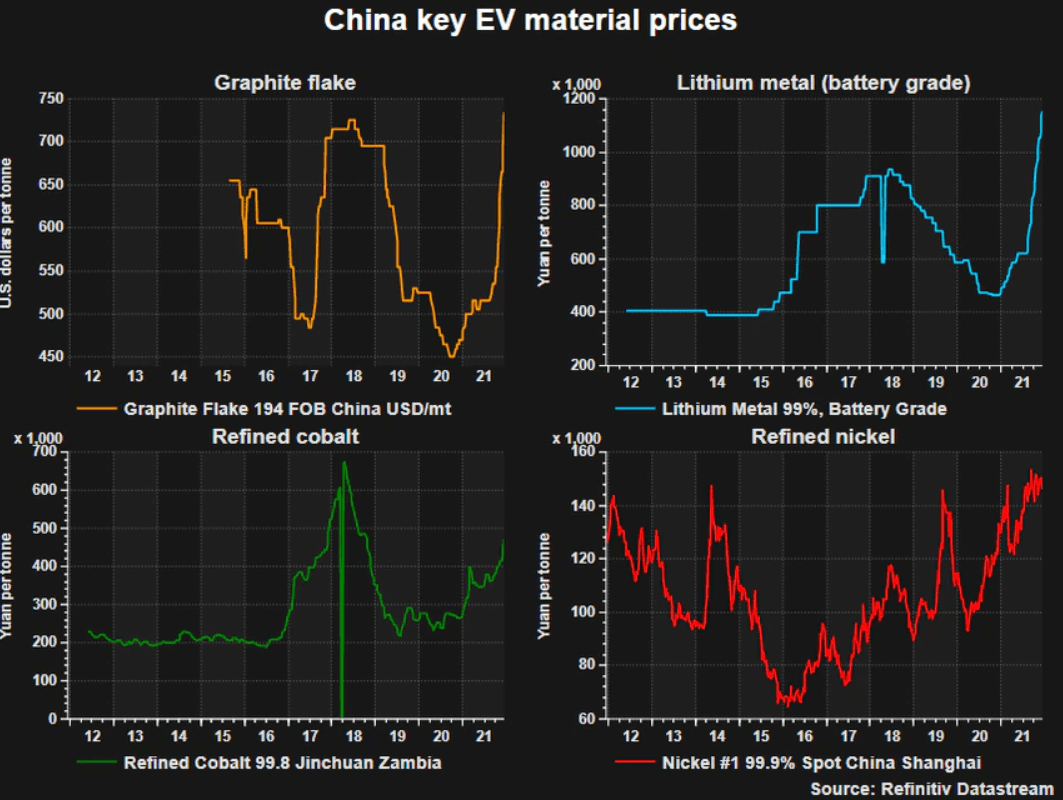
The biggest opportunity we currently see is in green battery metals. Below is the price of the four largest green battery metals (courtesy: Reuters): lithium, graphite, cobalt, nickel.
In our Momentum Investing weekend update, published yesterday, we tipped 3 graphite stocks and 1 cobalt stock. They are, by far, the best setups we have found among hundreds of stocks in that space.
Why not lithium?
Because lithium miners went up multi-fold between July and November. We hit this big trend, and all our lithium tips went up between 100% and 300%. All of them.
Graphite and cobalt stocks have been lagging, and that’s the opportunity we see. We expect both sectors to become as bullish as lithium miners were a few months ago.
In case markets are starting a 3 week mini bull run, we expect graphite and cobalt stocks to outperform. We will be exiting in the 3d week of January unless our crash indicators will be soft by then.
In our ‘latest and greatest’ momentum alert ‘[Must-Read] Graphite And Cobalt Starting To Heat Up, Will January Be THE Month?‘ we showed hidden reversal signals on the chart. Based on a mathematical formula we are able to find crucial days and prices in reversals, and the ones we see in the graphite sector are astonishingly accurate (hence, bullish).
Here is another opportunity that comes with elevated volatility: short term trades, both on the long and short side.
The big innovation that InvestingHaven brings to the able is auto-trading the S&P 500, in two distinct ways: we auto-trade 3x leveraged ETFs (SPXL + SPXS) with an algorithm which has been refined for more than a year, we auto-trade SPY options (only for 2022 VIP members).
The problem we are solving is that since the Corona crash we saw a structural shift in markets. Any time we got a short term momentum trend it unfolded faster than ever before. Manual execution of orders based on algorithmically calculated buy signals does not work as it used to work pre-Covid. Automated execution of orders became a must since 2020, and we saw the proof of this in 2021.
Moreover, many of our members indicated that they cannot act fast enough because they are busy with other things in their life.
Automated trading which we introduced around summer time offers opportunities when markets get volatile. Moreover, it offers max convenience / max accuracy / optimal allocation management / better exit prices. This tends to deliver more profits. Readers who are interested in the performance of our signals (algorithm) can check our SPXL signal log.
Momentum Investing members receive a detailed weekend update with broad market analysis, portfolio updates, green battery metals updates. In our Trade Alerts we introduced automated trading: automatic execution of our accurate buy/sell signals in the S&P 500 ETFs SPXL/SPXS. The last trade was 8% in 4 days, automatically executed, our members continued their daily life without being concerned about markets during trading hours.


