
As financial markets analysts and chart analysts, we use the Russell 2000 as a reliable momentum indicator to forecast momentum trends in broad markets. The Russell 2000 represents small caps and has been a reliable leading indicator in the past. In this article, we will analyze the chart pattern of the Russell 2000 between November 2021 and today to understand its current momentum trend. The conclusion is that we are not expecting a market crash but we do predict broad market weakness.
Interestingly, as bullish sentiment is rising, our sentiment is once again going against the tide.
A while ago experts were very bearish and we were bullish:
Are Economic Experts Lying Or Confused Or Both?
Is Dr. Copper As Concerned About The Economy As Experts?
The Market Will Not Move 50% Lower Contrary To What The Gurus Are Telling You
Now, we start getting some early warning signs from our leading indicators, one of which explained in this article but also one from last week: Dr. Copper Is Sending A Soft Warning Sign.
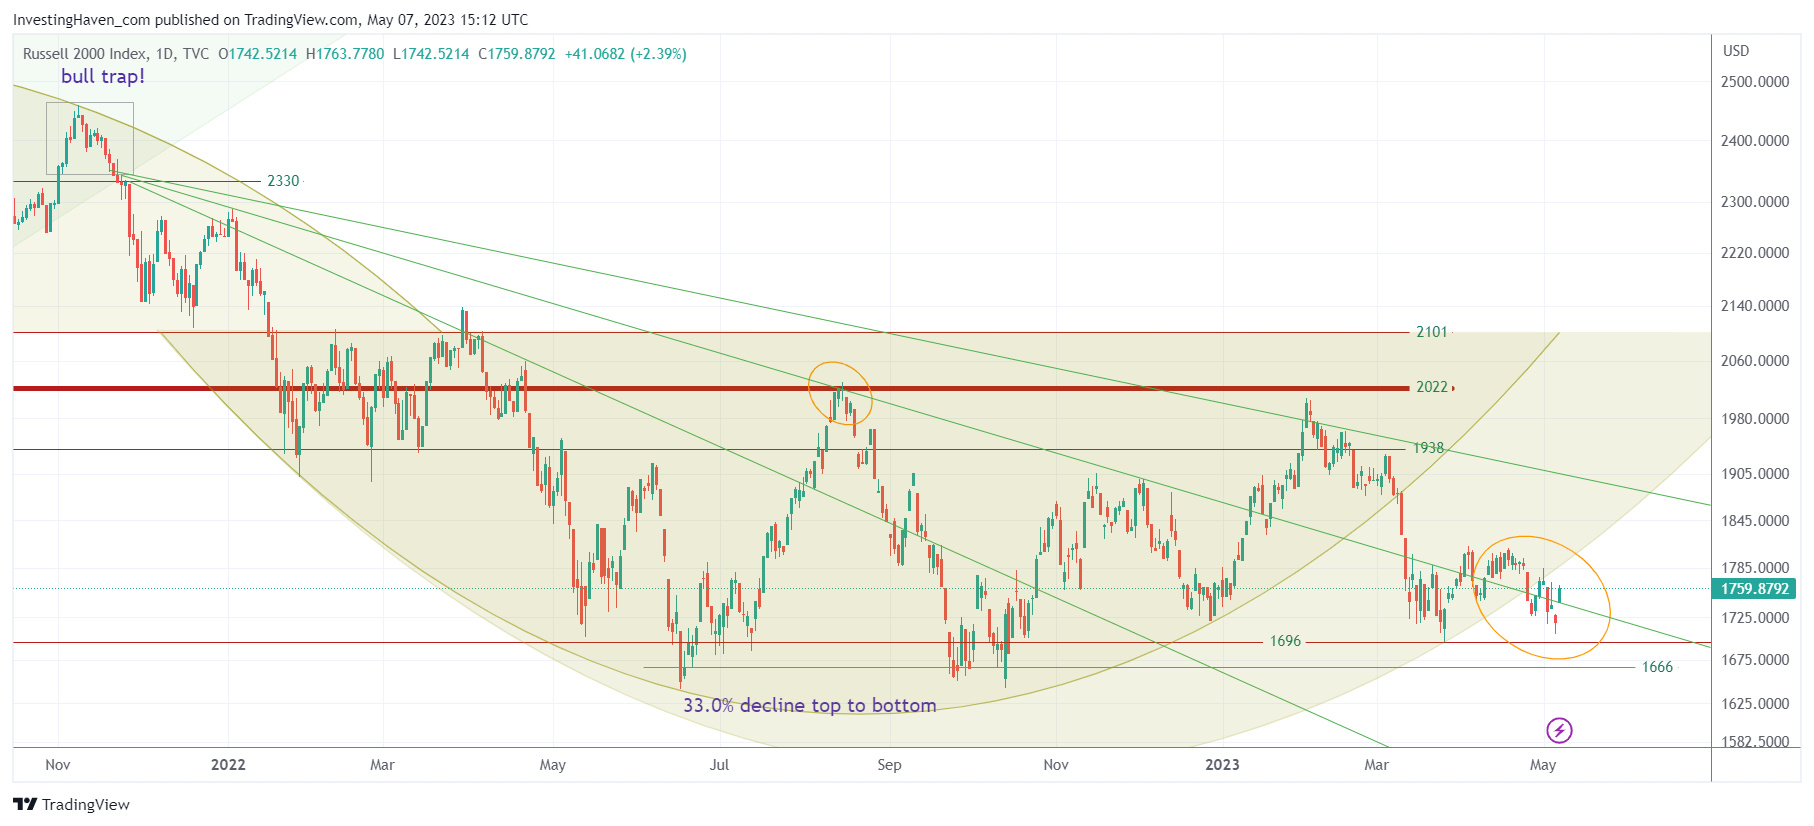
Consider the following points, based on the Russell 2000 chart shown below:
1/ The chart pattern of the Russell 2000 started with a bullish reversal early in 2022, taking the form of a rounded pattern. However, for this pattern to hold, it has to remain within certain levels of support and resistance. The support level for the Russell 2000 is around 2,150 points, while the resistance level is around 2,400 points. As long as the index remains within this range, the rounded pattern remains in play.
2/ The rounded pattern of the Russell 2000 can widen up to three times, and the index is currently in the second widening phase, with the first widening taking place in early March. This suggests that the current momentum trend of the Russell 2000 may be losing steam, and the index may soon experience a change in direction.
3/ The Russell 2000 is also trading between three green falling trendlines, with higher slightly higher lows. This is a positive sign for the index, indicating that the bullish momentum is still in place, and the index is not yet in danger of a significant downward correction.
4/ We are now nearing May 15th, which marks the mid-point of the current three-month cycle. Historically, this has often been a turning point in markets, but this is not always the case. As financial markets analysts, we must remain vigilant and closely monitor market conditions to assess the potential impact of this turning point.
5/ Recent weakness in the Russell 2000 a few days before the mid-point of the three-month cycle makes us concerned. While it’s important to note that the Russell 2000 is still within the range of its rounded pattern, the recent weakness may indicate that the index is struggling to maintain its bullish momentum.
Conclusion: Based on our analysis of the chart pattern of the Russell 2000, we prefer a defensive stance and look for exposure in markets that may do well if broad market momentum weakens. While the Russell 2000 is still within the range of its rounded pattern, recent weakness and the approaching mid-point of the three-month cycle make us cautious about the index’s ability to weather a mid-cycle turning point. As financial markets analysts, it’s essential to stay vigilant and closely monitor market conditions to identify potential risks and opportunities.
In our Momentum Investing service we are taking a directional bet on one specific market sector for the months May and June, as explained in this week’s premium service alerts.


