Information overload is one of the biggest problems for investors nowadays. It is mentally not easy to accept the fact that you will use LESS, not more, information for your investing decisions. It is counterintuitive. We would suggest to look at the following 2 charts only, ultimately complemented with 2 to 3 leading indicator charts. That’s it, those few charts only to understand and forecast stock market direction? Yes!
Before looking at the two charts we believe are the only ones to track in the world of stocks we will include a quote from one of our educational pieces.
In our Momentum Investing service we share a highly educational piece to our premium members every weekend, full of investing insights. Similarly, our Trade Alerts service features educational insights for traders, every weekend.
The next paragraphs come from our educational piece Momentum Investing: Meet Your Biggest Enemies (August 30th, 2020), and it is a piece that we wrote in the section “Enemy #4” in that weekend update:
[start quote]
There is this intuitive belief that more information leads to better investing decisions. So in an age of information overload it automatically leads to the belief that one should be able to outsmart all other investors provided the investor acquires a high volume of information and data points.
Nothing is further from the truth.
And here is the big pitfall: relying on too much information when making an investing decision leads to a high level of confidence.
This becomes evident according to research when observing professional fund managers.
It might be tempting to think that fund managers are more akin to weathermen but sadly the evidence suggests the opposite. The author of the Little Book of Behavioral Investing explains how fund managers leverage information in their investing decisions, leading them to a high level of confidence on the success of their investment. They believe they are a step ahead of the herd, making them believe they get in before everyone else and get out before everyone else.
Despite the evidence it seems that this is exactly what a large number of investors spend their time doing – trying to be the smartest person in the room. So if we can’t outsmart everyone else how on earth can we invest? The good news is that we don’t need to outsmart everyone else. We need to stik to our investment discipline, ignore the actions of others, and stop listening to the so-called experts.
And don’t forget, when it comes to information: there is always, ALWAYS, a reason to justify the opposite trade. You may have looked into a long position, and got re-assurance from whomever or whatever out there. But there are equally great points to be made, rationally, that the opposite trade is a good one.
Information overload will result into decision paralysis, over-optimism will result in a wrong decision.
LESS IS MORE
[end quote]
With all that said, let’s review the 2 stock charts we are talking about.
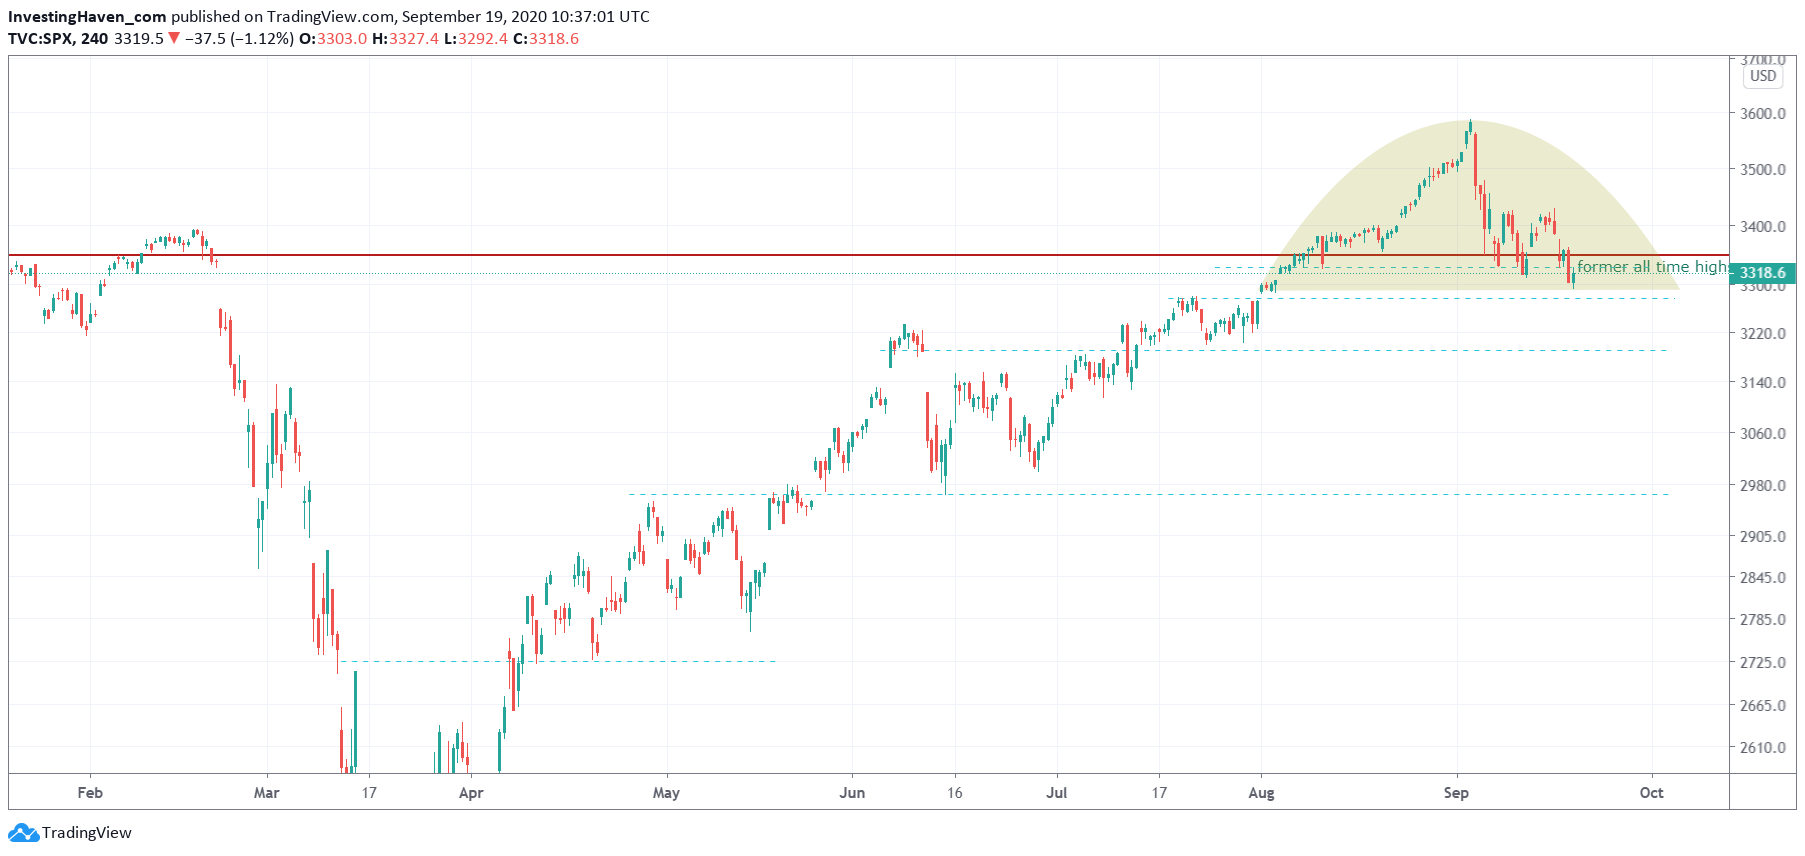
The S&P 500 chart (daily) shows a bearish topping formation, right above former all time highs.
Will this break down?
Potentially, yes, and it might become nasty once it happens.
However, as long as the 3295 level is respected there might also be a bullish reversal that comes out of this setup. The jury is out, and the critical levels are clear for the short to medium term.
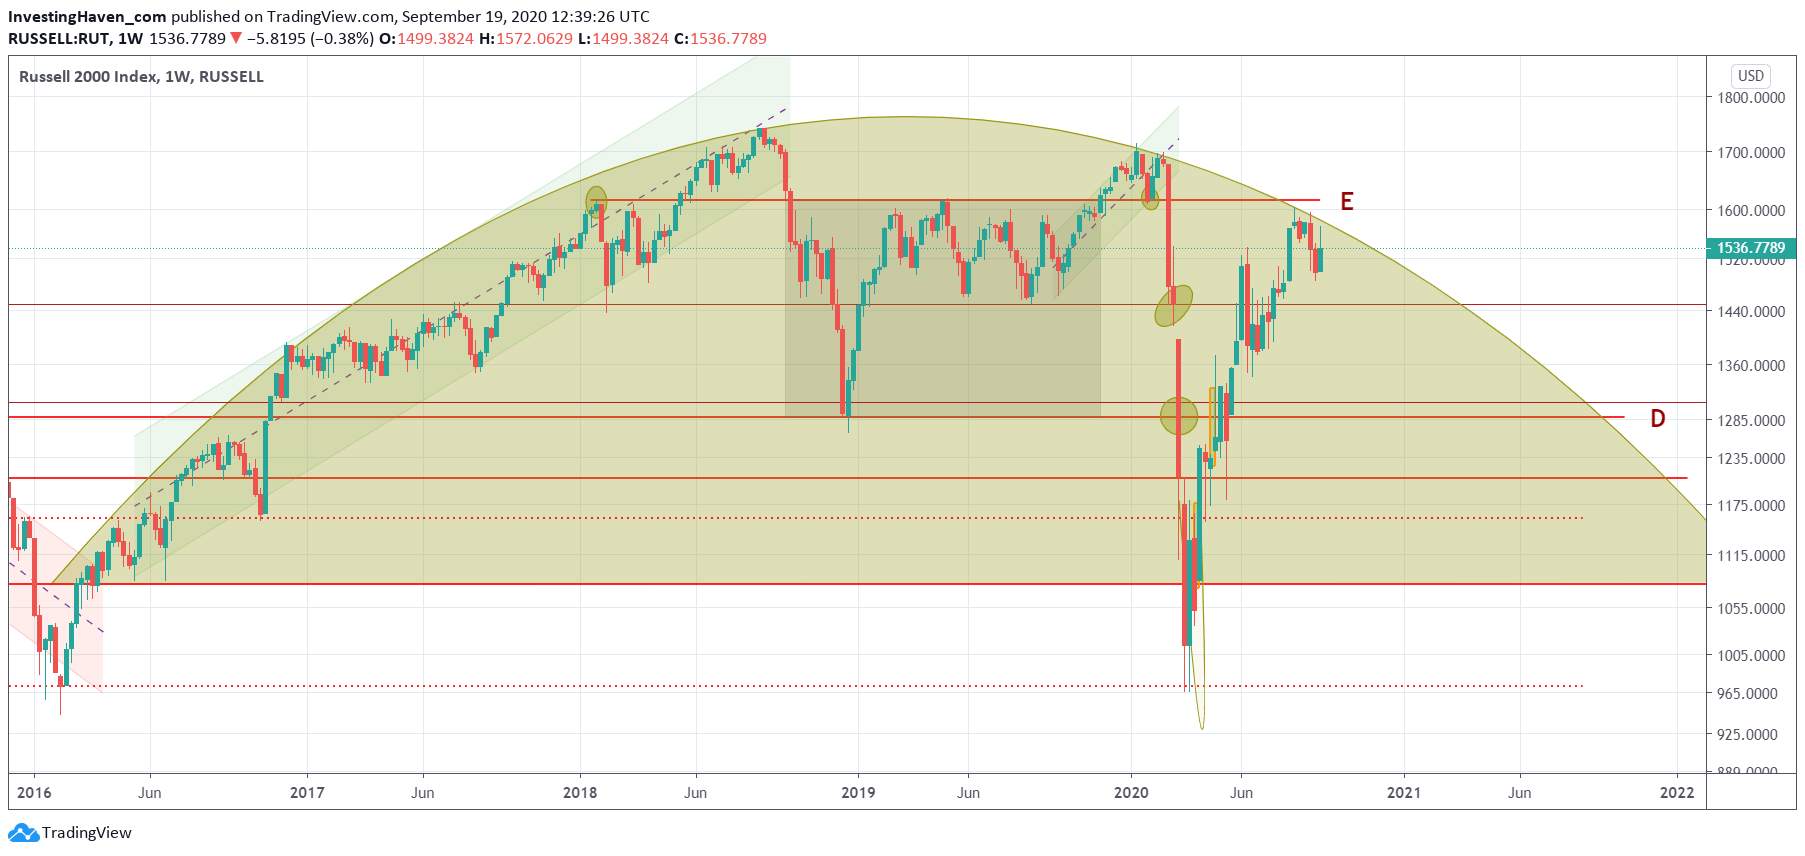
Longer term we prefer to use the Russell 2000 chart.
The weekly timeframe below shows a long rounded formation, over 4 years.
This chart is very clear as well: a ‘break up’ is the only bullish outcome here, and as long as it doesn’t happen there is a sell off risk. The support level to watch is 1500 points. The ‘break up’ ideally happens above current levels.
Enjoying our work? We use the concepts outlined in this article constantly in determining entry and exit points in our Trade Alerts premium service. With our proprietary analysis and decisioning concepts our Trade Alerts portfolio is delivering close to 90% profits at the time of writing. We are on track to double our capital in 2020, as per our Mission 2026.


