There are (too) many charts that investors can track nowadays. There are (too) many indictors that investors can track nowadays. There are (too) many financial content sources. There is one single chart that investors should track in the first months of 2023. It is the S&P 500 chart with the pattern that is available to see by those who are able to spot it. It will heavily and directly influence most of our 2023 forecasts like our stock market crash prediction (no crash), silver forecast, 2008 vs. 2022 similarities, etc.
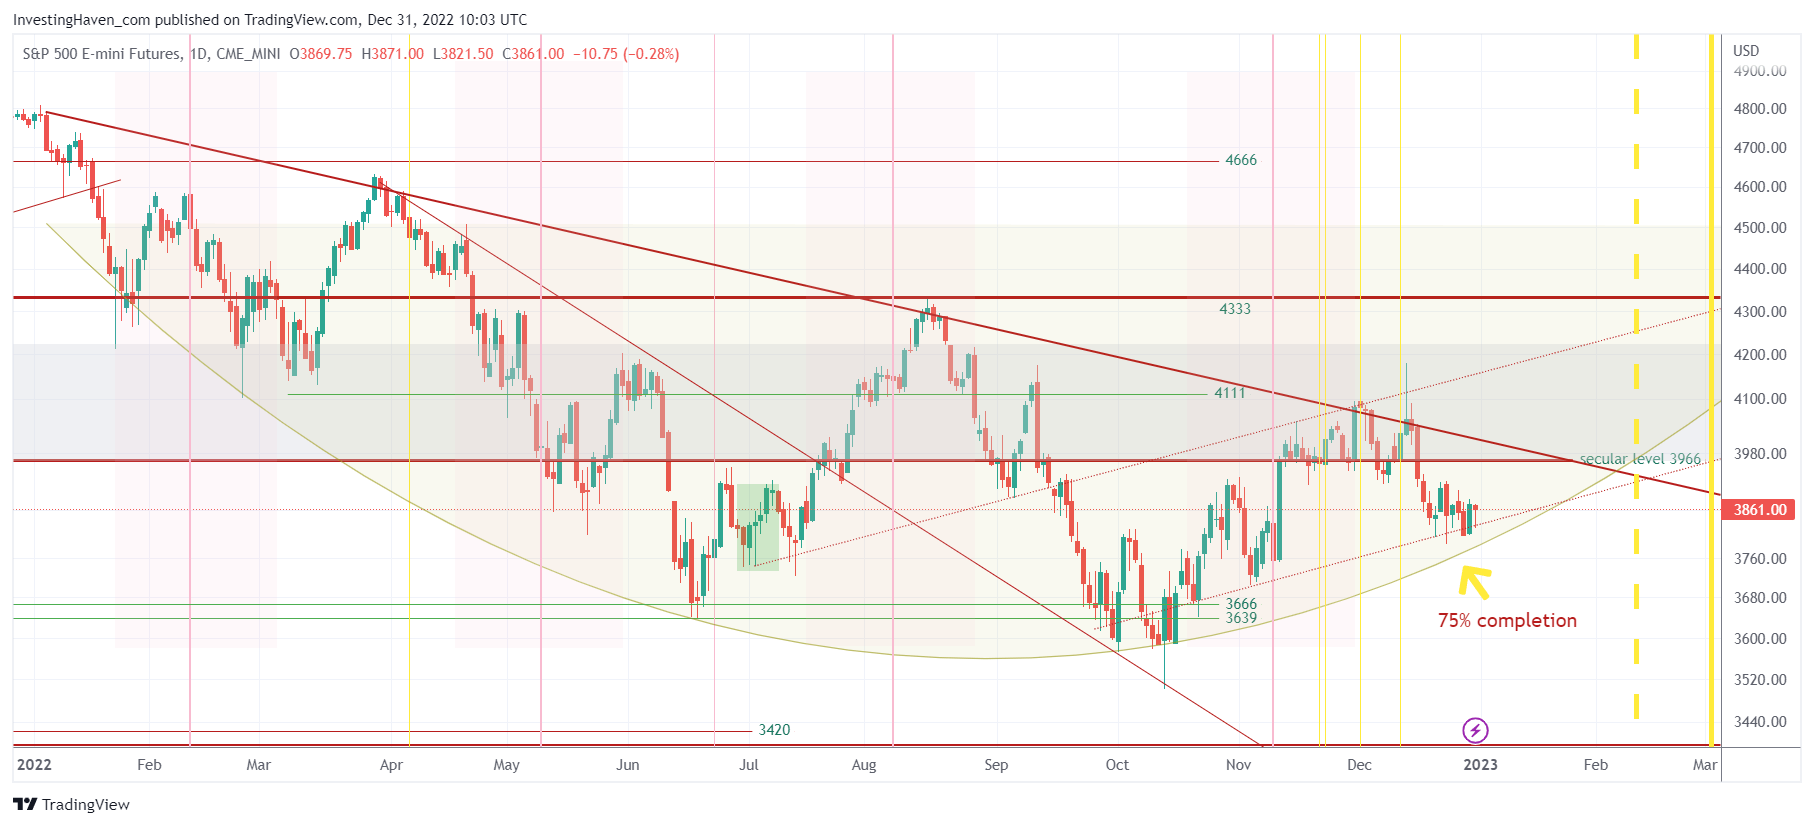
The one chart we are talking about is the first one in this post.
The source: our premium research service Momentum Investing. In one of our most recent research notes Must-See Charts: Q1/2023 Will Be Crucial, 7 Timing Conclusions, 2008 Comparisons we included many more such charts. We also derived 7 conclusions from timeline analysis from those charts, crucial in tracking the path for markets in 2023.
This is a quote from our research note:
The S&P 500 index chart is past 75% completion of the current rounded reversal. If a really aggressive downtrend was about to start, it would have started a few weeks ago. This current pattern is approximately 80% complete. The very narrow space between the rounded pattern and the downtrend line is what stands out. This pattern has to resolve by mid-January approximately in ‘a’ direction.
While it feels very uncertain and certainly not bullish at all, the long term pattern is, at this point in time, has a bullish structure. The rounded pattern that was dominant in 2022 is a bullish one.
Very, very important: note that the S&P 500 crossed the crucial point which is 75% completion. With each passing day within this rounded pattern, the probability of a bullish outcome increases exponentially.
The big challenge and test will be once this index gets back to the falling trendline which is likely going to happen in the first 2 to 3 weeks of 2023.
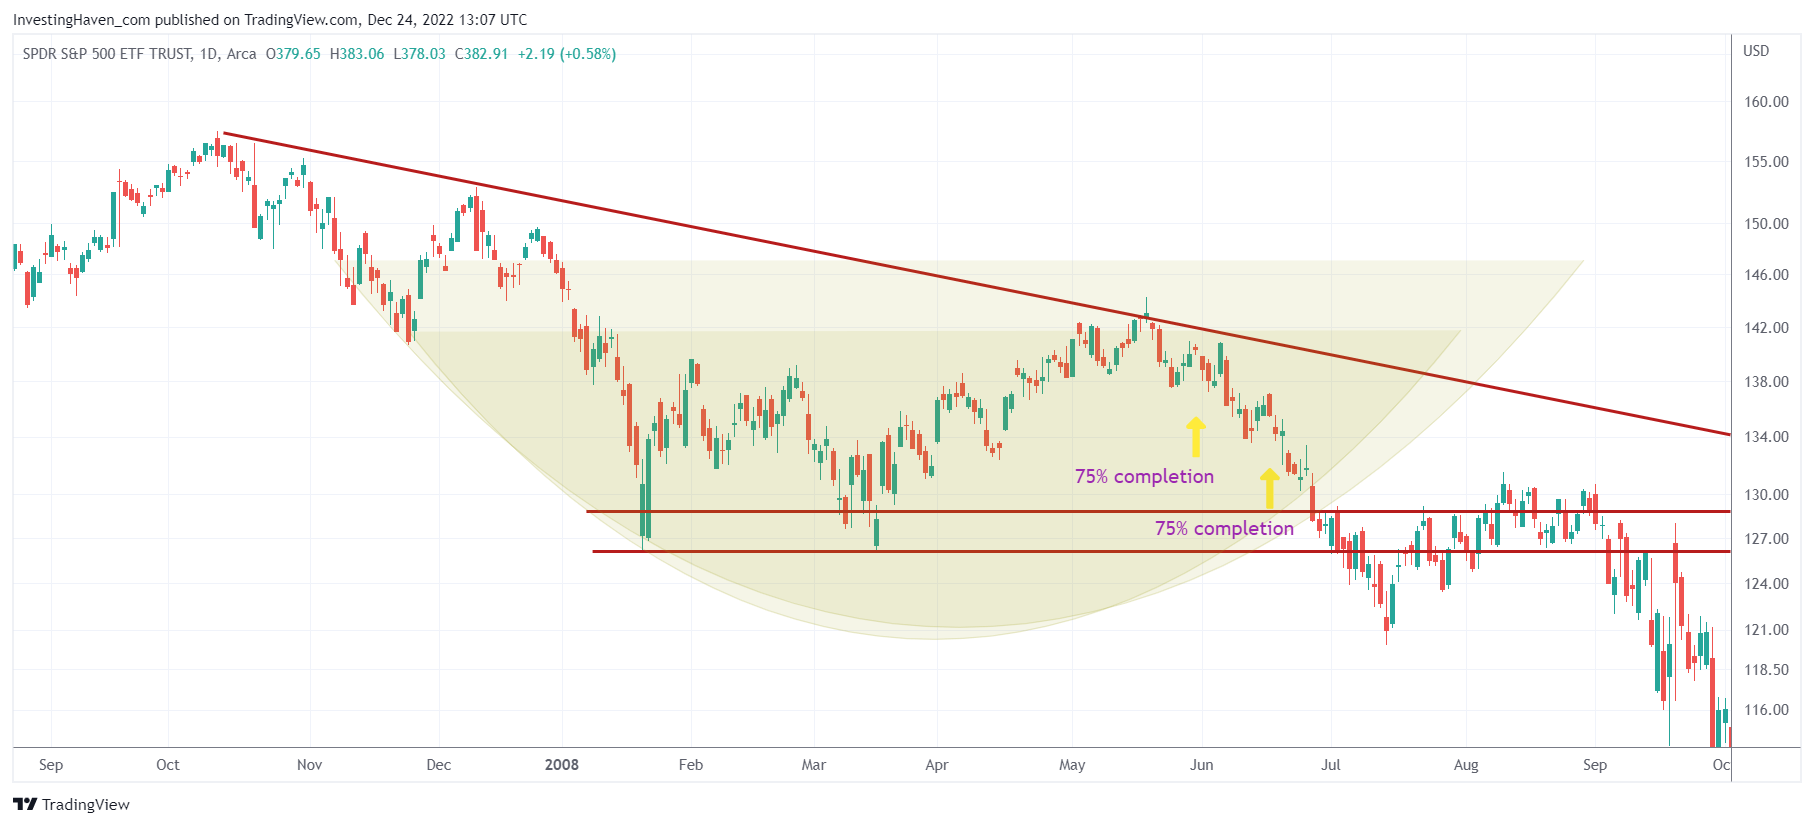
As a comparison, below is the S&P 500 chart in 2008, prior to the big decline going into Q1/2009. This is what we wrote in our research note:
The SPY chart broke down right after 75% completion of the rounded pattern (arguably, there were 2 such rounded patterns). Note that the double bottom of 2008 was really weak, both in terms of price and time. Today’s reversal setup in the S&P 500 is more solid. At present day.
There are many more 2008 charts in the note that is available in the archives in our restricted area for Momentum Investing members.