
There is so much talk about hard landing, soft landing, even no landing scenarios. It’s a complicated topic, for sure, there is also not one single indicator that will predict which landing we’ll get. However, there are a few indicators, when combined, that can help us tremendously in filtering out noise and focusing on the primary trend (as well as trend changes). One such indicator is the Nasdaq volatility index which is playing a hugely important role in understand primary trends and trend changes, according to our view, as explained in Here Is Why Volatility Analysis Can Be Powerful And Even Predictive.
Note that volatility indexes are really hard to read and understand. Also, all of them work in a very different way. It’s not easy which is exactly why it is effective and powerful once you master it!
Unlike a regular stock market or index chart (like SPX or Nasdaq) you read the Nasdaq’s volatility index as a stretch indicator and combine it with chart patterns.
The way we read the current setup in the Nasdaq volatility index is as follows:
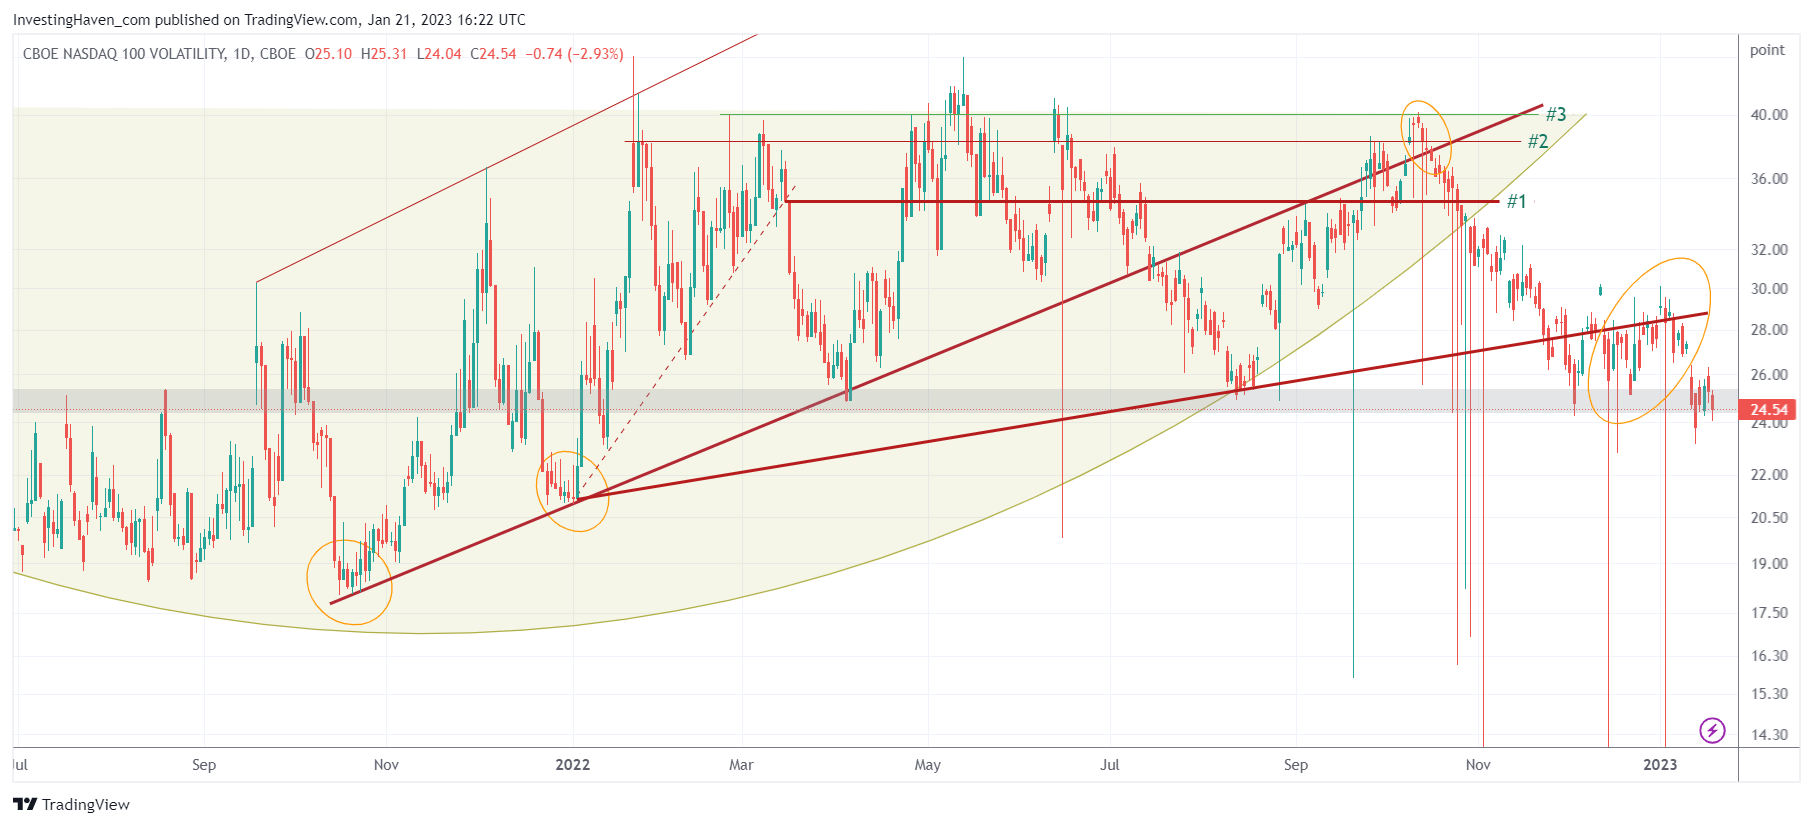
- The long term bullish setup (bearish Nasdaq) was a rounded pattern, it was broken to the downside around November 9th (when the first better than expected CPI reading came in).
- Since then, this volatility index found support at its 2022 rising trendline. This coincided with a violent test of support levels in the Nasdaq, a process that took 2 months to complete.
- Since last week, the Nasdaq volatility index fell below the 2022 rising trendline. This may signal that the market is working to conclude the bear market.
The bear market in the Nasdaq (bullish setup in its volatility index) will be over once the Nasdaq volatility index falls below 24-25 points, see grey bar on below chart. Note that the ‘bear market being over’ is a process, one that is going to last longer than most investors desire. It will also come with sudden moves that will invalidate. Be prepared, it won’t be straightforward.
 Interestingly, the above is happening right at a time when the tech sector as represented by ETF XLK is confirming a bullish pattern. As explained in Tech Stocks Attempting To Take Over Leadership, Really?
XLK ETF is thoroughly testing its long term uptrend. It did not break down. Let’s repeat this: the tech sector did not break down, its primary trend is UP, not down. Its chart shows a violent test of support. Since October, tech stocks fell below their rising trendline but they always recovered with 3 to 5 days. Moreover, there is a rounded pattern in the making, right at support of the long term rising trendline. For starters, this rounded pattern is BULLISH, not bearish.
The Nasdaq volatility index combined with the XLK ETF have a more outspoken setup than the Nasdaq index. They are more concise and come with sharper readings.
In our stock market investing service Momentum Investing we took positions in several tech stocks, several weeks ago. Our tech stock selection revealed several gems, some of them hidden gems.


