In our Trade Alerts weekend analysis on July 16th we spotted the start of the summer rally exactly the day it started. This is what we wrote in our research note on July 16th: “Volatility indexes are breaking down. This is happening as the USD is topping. We expect markets to stage a summer rally, initially a relief rally which can become the start of a bigger uptrend going into 2023.” Our proprietary volatility analysis is very powerful and also predictive, a must read component in anyone’s methodology.
As investors in 2022 we are used to consume a lot of financial information. Arguably, we are addicted to a constant stream of lots of data. For sure, we desire way too much information (much of it qualifies as ‘noise’).
The problem with this desire for information is that we tend to spend less on previous findings and thinking. There is nothing as powerful as going back and analyze how we were thinking, at a point in the past, about future price action and its influence on our decisions. It is the only way to improve trading and investing skills.
In our weekly Trade Alerts research notes we include detailed chart analysis on 6 distinct volatility indexes. Think VIX and VXN, but also VIXY. They not only help to understand the trend in SPX to play instruments like SPXL, more importantly they do so “as it is happening”.
That’s the difference between a leading indicator which is predictive and a technical indicator which is lagging.
Note that volatility indexes are really hard to read and understand. Also, all of them work in a very different way. It’s not easy which is exactly why it is effective and powerful once you master it!
Here is our volatility analysis from exactly one month ago: Volatility Indexes Are Breaking Down (July 16th, 2022)
- Short term volatility is coming down and the 12 month triangle setup might finally move to support or even lower. No breakdown yet, but this volatility index is losing steam, clearly!
- The Nasdaq volatility index finally broke below the 8 month rising trendline. This rising trendline originated around November 9th (the hidden 6 month cycle). The touches, since then, resulted in strong bounces. This one might be different and it is happening right at the point where we put our green arrow (already a while back).
- The Nasdaq has been leading markets lower. It looks like the Nasdaq will get markets out of their depressed state. Its volatility index is very clear in this, more clear than the Nasdaq index itself.
- VIX also started breaking down. It did so 2 weeks ago, bounced back up, but we believe there is a high probability that this current breakdown will be for real especially given the topping setup we clearly see in the USD.
- Conclusions: Volatility indexes are breaking down. This is happening as the USD is topping. We expect markets to stage a summer rally, initially a relief rally which can become the start of a bigger uptrend going into 2023.
The bullet points are copied from the alert dated July 16th.
Pretty accurate, isn’t it?
These were the type of headlines that were hitting the wire when we concluded the above:
Wall Street’s Latest Bear Market May Be Here to Stay for a While
That said, what do we conclude about the current state of volatility indexes?
Last week, we wrote This Is Why Volatility Will Come Down And What It Means For Investors. That was a longer term oriented view. Below is a shorter term oriented viewpoint.
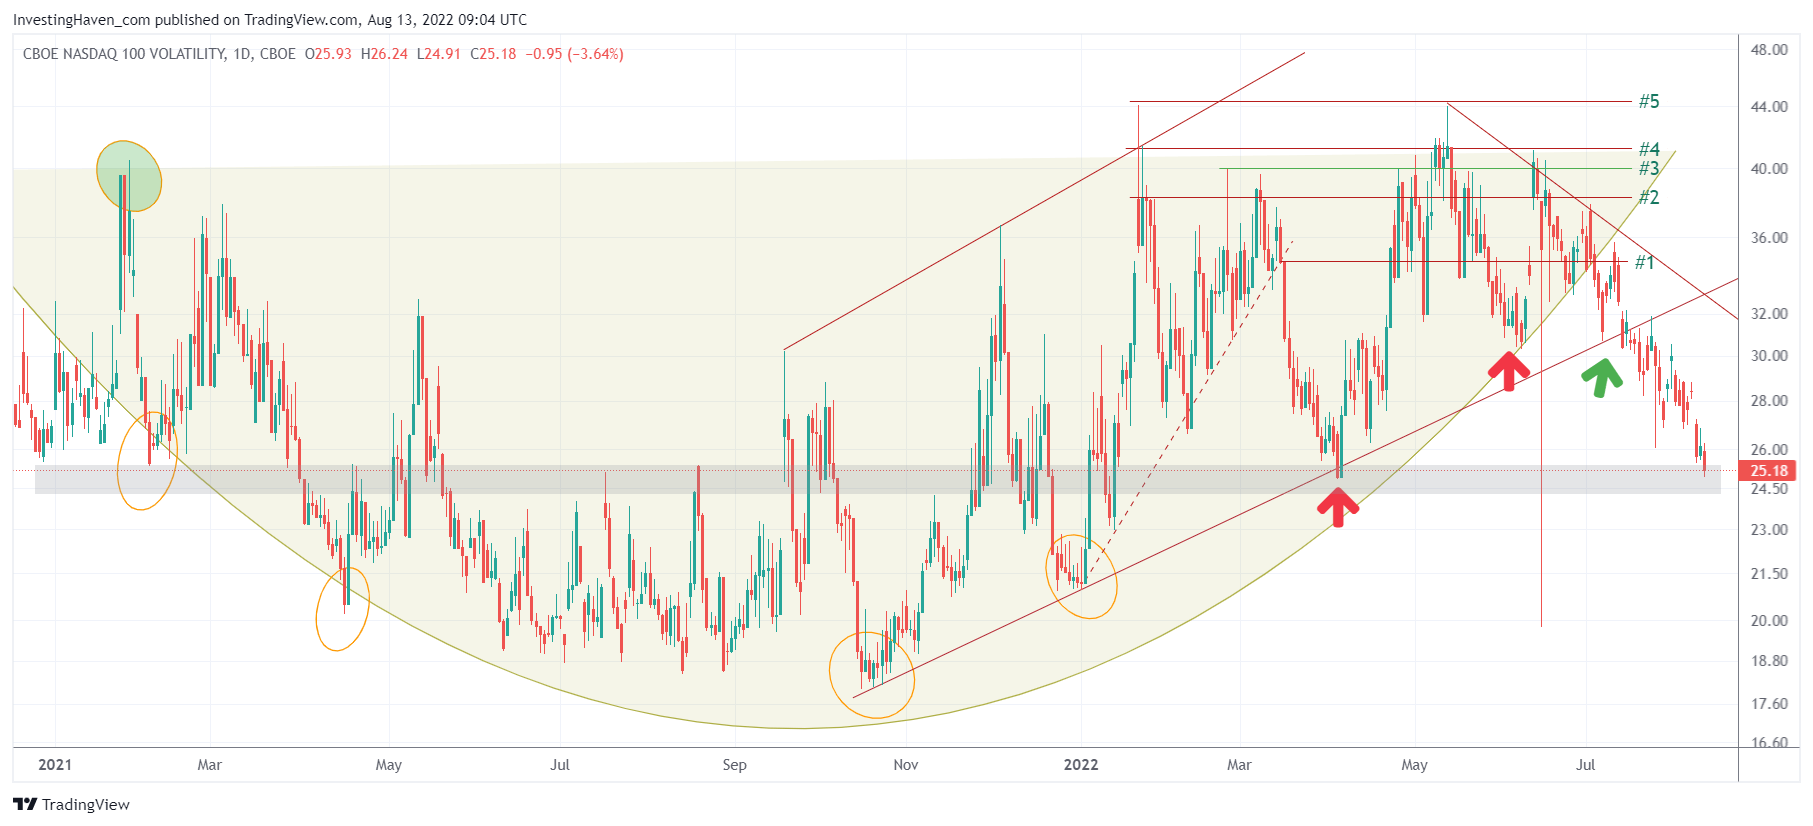
We include one of the 6 volatility indexes from our latest Trade Alerts research note: the Nasdaq volatility index. In our latest note “Is The Summer Rally About To Hit Resistance?” we said that it might have been a powerful rally but the point of resistance is not far away. We expect either the grey bar on below chart (inversely correlated with the Nasdaq) to be the first point of hesitation. Note that these indexes work on a 3 to 5 day daily candle basis, so even a breakdown of the grey bar requires a 5 day validation (failed breakdown is possible).