Markets should resume their uptrend the latest in March of 2023. That’s one of the most relevant insights for investors that we got out of our Dow Jones long term charts.
This post provides a summary of two Dow Jones related articles which now have up to date long term charts.
From our article Dow Jones Historical Chart On 100 Years we conclude that the Dow Jones reached the top of its 100 year (!) channel. Any time in the past this happened (1929, 2000, 2020) it resulted in massive market sell-offs. The one big difference between now and back then is that those previous rises to the top of the channel came with very steep, multi-year rallies. The 2021/2022 test of the top of the channel did not come after a steep rally.
We don’t believe that the Dow Jones will start a massive sell-off and are patiently looking for evidence that the market proves this right.
In our article Dow Jones Long Term Chart On 20 Years we featured the ‘risk off’ periods since 2007. Every such period tended to last between 12 and 24 months. The ongoing ‘risk off’ period should come to an end in January of 2023 but not later than the 2nd half of 2023.
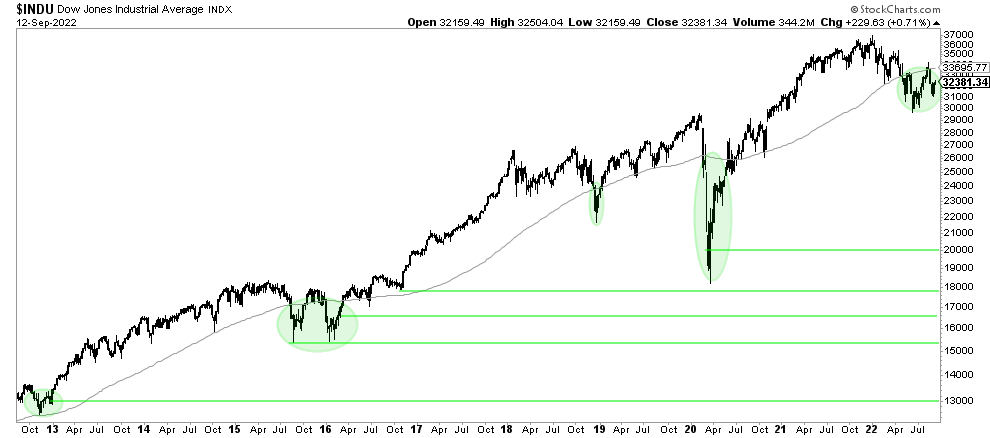
Moreover, the 10 year Dow Jones chart with the 90 week moving average provided more valuable insights.
As seen, ‘risk off’ periods typically come with a period in which the Dow Jones trades for a certain period of time below its 90 week moving average. In 2015/2016, it took the Dow Jones a double W reversal over 12 months. In 2018, the pull-back below the 90WMA took some 3 months. In 2020, it took the Dow Jones some 6 months below its 90 WMA.
In 2022, the Dow Jones fell below its 90 WMA in April. We can reasonably expect that the Dow Jones will clear its 90 WMA the latest in March of 2023. Note that the level to clear is 33.6k points, just 6% above the 31.7k points ‘line in the sand’ level we mentioned before.
If history is any guide we should see a bullish reversal below the 33.6k level which should be complete the latest in March of 2023. The levels that really matter are 31.7k and 33.6k for reasons outlined in our detailed Dow Jones analyses.
The chart below is one of the many up to date Dow Jones charts that should help investors put the very uncertain and weird year 2022 into perspective!