
Good time always seems to be short life because another year has passed with a blink of our eyes, and additional monthly candle was registered in the historical chart for all asset classes. How some investors seem to get it right with positive results while some investors took the wrong decision that ended up either negative or undesirable results will become trivial now. The reason is simple because the market doesn’t really care about your winning or losing trades but keeps threading forward, hence before investors can really reflect on their scorecards of year 2017, the 2018 clock has started ticking.
These 4 series article is really inspired by tremendous amount of email inquiries regarding what stocks to buy and how long to hold if they only have this amount of capital at hand. We recognize that this is simply one of the major “mental” limitation many investors encounter as they do not have millions at their disposal compare to the fund managers, banks, institutions and etc. Well, all is not lost.
In an attempt to mimic an investor with only $12,000 (arbitrary number) at hand, InvestingHaven will adopt a broad-based investment strategy to cast the net on future trends, overall health of entire market sentiment, dividend, aggressive and traditionally defensive stocks to verify how different the results will be at the end of 2018. For investors having five to one hundred thousands dollar, the strategy will be proportionated according to $12,000. There is no right or wrong investment strategy as long as it is profitable, the only difference is how profitable is the adopted strategy.
A paper profit and loss statement of capital gain or loss will be shown on subsequent series (each quarter) to review whether to keep the same selection of stocks, to shed some or to replace some. Other limitations imposed including no short-selling of stock is allowed, peril of quarterly earnings or unexpected news may cause the price to gap up or down, commission of trades will be excluded and dividend received will not be computed. We do expect a fair share amount of contention on our methodology but we will stick to it.
It is an undeniable fact that the sustainability of a business hinges vastly on the current and future demand of the customers As business grow progressively, the amount of data generated globally at light speed requires the deployment of massive server or data house as a mean of storage. This is exactly why Cloud based solution provider will most probably enjoy yet another year of good profit though many small and mid-cap companies are pitting against the giants
#1 – Cisco System, Inc (Ticker – CSCO traded in Nasdaq)
Ever since the dotcom bubble collapsed, Cisco’s stock price has been consolidating around 11 – 30 for the past 17 years as can be seen from the monthly chart. And it managed to break the 34 mark in Oct 2017. Cisco has its roots in networking hardware. So what makes us think there is a bullish case for this stock?
When the stock price broke long term horizontal resistance it was a major event especially when Cisco paid 1.9 Billion into cloud business. Yes, there is no 100% guarantee that it will be a success but we see the commitment of Cisco System to compete with the established top 10 players. We project that price can hit 50 by 2018. The previous top of 81 could be tested after 2018. We do not exclude an unexpected swift plunge to around 34 on its way up
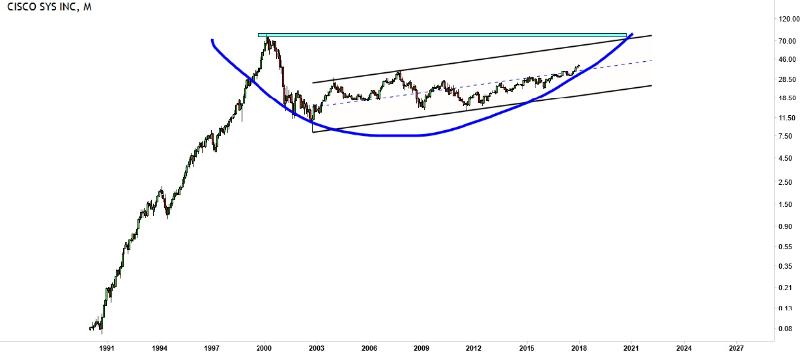
Cisco System, Inc monthly chart
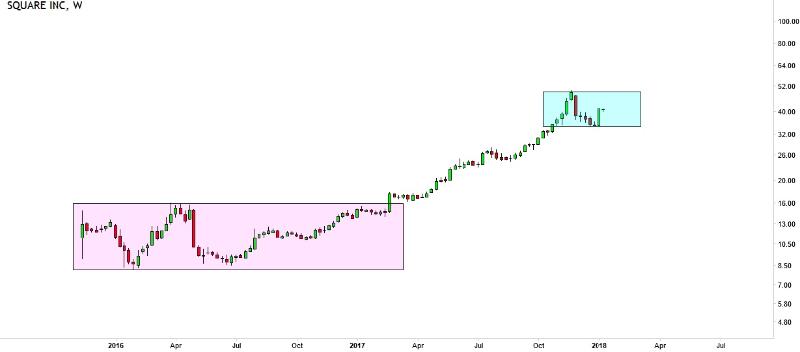
#2 – Square, Inc (Ticker – SQ in Nasdaq)
Square, Inc. provides mobile payment solutions, develops point- of-sale software that helps in digital receipts, inventory, and sales reports, as well as offers analytics and feedback. Square also provides financial and marketing services. The decision to involve themselves in blockchain technology right at the start is what differentiate them from the competitors such as Paypal, Shopify and Intuit. By studying what their competitors do, Square, Inc managed to crave out a small competitive edge. Given that the bitcoin initiative program is expanding and eventually allowing users to send and receive bitcoin and the ability to pay merchants with it would go a long way.
Square, Inc weekly chart
Weekly chart of SQ broke out of the consolidation in Feb 2017 followed by an impressive run that topped up at ~50. Two scenario could happen, first – price could consolidate in the zone for a couple of weeks before it breaks out or two – price will literally reach previous resistance of ~50 by March. Generally, it has an underlying bullish structure. It could even reach as high as 60 by end of 2018. Should any unforeseen situation that causes the price to reverse drastically, ~23-27 will be an important support. That will render our bullishness to neutral.
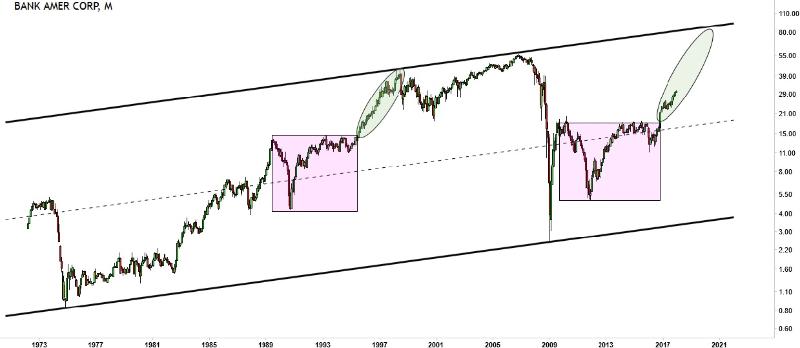
#3 – Bank of America Corporation (Ticker – BAC in NYSE)
With more rate hikes on the table from the Federal Reserve (FED) into 2018-9, this essentially signals the onset of global-based full fledge economic growth. Financial sector especially banking stocks will benefit directly as lending, corporate finance and mortgage activities increases correspondingly.
Bank of America Corporation monthly chart
If the current price recognition is true, there could be a repeat of what happened in the 1990. Price had a consolidation in the pink box, upon breaking up, it goes at 45 degree angle (strongest bull market strength) that finally got saturated in the dotcom bubble in year 2000. Base on this argument, the current price could be on its way to ~80 before a significant correction could materialize. As for 2018, the projected target is ~40. On the contrary, if price does retrace, 25 dollar zone is particularly important.
#4: AEGON N.V. (Ticker – AEG in NYSE)
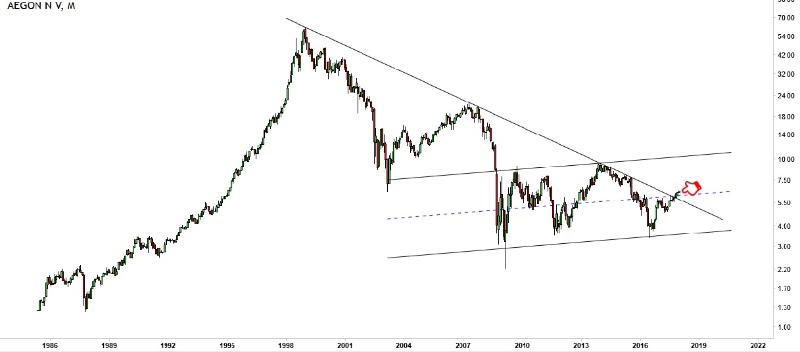
Aegon N.V monthly chart
Aegon N.V. is a multinational life insurance, pensions and asset management company headquartered in The Hague, Netherlands. It is also listed in NYSE as an ADR stock. The monthly chart of Aegon posted above has an interesting multi decade downtrend since the stock topped in December 1988. For the last 29 years or so, price has been moving in a rock solid downtrend which was finally broken in November 2017. Our first price target for 2018 is around 9-10, and any price beyond it will be an exceptional bonus. The flipside is a break below 5.5, that would negate the upside projection. Insurance is an integral part of financial sector which will also benefit from growing economy.
#5 – American Green, Inc. (Ticker – ERBB in OTC)
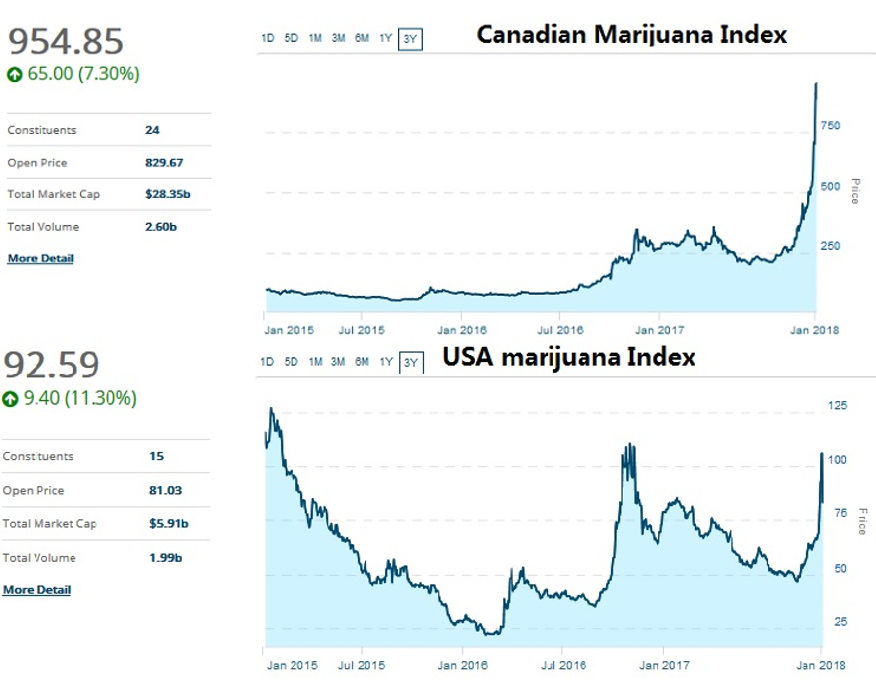
With Canada look set to fully legalize marijuana in 2018, (http://www.bbc.com/news/world-us-canada-39411026), we believe that its neighbour the United States of America will not want this opportunity to slip by. The comparison of marijuana index between Canada and American shown that the latter is ten times undervalued and definitely plenty of upside potential in the coming years.
Phoenix, AZ based American Green Inc, engaged in the medical marijuana business. The Company offers a line of products spanning from cultivation to tracking inventory for growers and dispensaries for medical marijuana. It also owns all of the rights to line of health supplements under the label OneBode. The company offers retailing, branding and commercial cultivating strategies in conjunction with its business with various licensed medical marijuana medical and retail dispensaries.
The most appealing vision of American Green, Inc is the purchase of Nipton, a town of California with the purpose to develop a cannabis friendly hospitality destination.
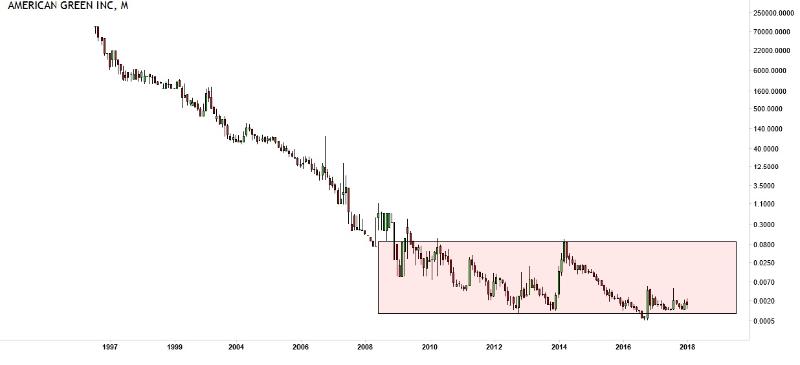
American Green, Inc monthly chart
Price of American Green, Inc (monthly chart) has been consolidating in the red rectangular box since 2008 and currently trading at the lower support band. The bullish target will be 0.09 but we are well aware of the risk of investing in OTC markets. That is the reason we only allocate 190 for this stock.
#6 – Heron Therapeutics (Ticker – HRTX in Nasdaq)
Heron Therapeutics is a biotechnology company engages in developing pharmaceutical products for patients suffering from cancer or pain. The Company’s product candidate, SUSTOL (granisetron) injection, extended release, is being developed for the prevention of both acute and delayed chemotherapy-induced nausea and vomiting (CINV) associated with moderately emetogenic chemotherapy (MEC) or highly emetogenic chemotherapy (HEC). SUSTOL is in Phase III clinical trials. The New Drug Application (NDA) is under review by the United States Food and Drug Administration (FDA).
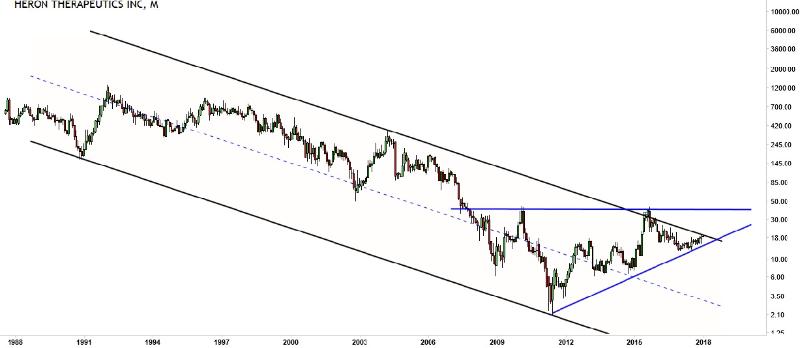
Heron Therapeutics monthly chart
The price of HRTX has followed the downtrend channel as shown. There was a first failed attempt to break above due to the same level of resistance formed in Feb 2010. Price has slowly creeping towards the edge of channel resistance for a major move. Besides, the entire price structure from 2007 to present has more or less morphed into an ascending triangle. Should price break the resistance, the projection target will be back to the previous resistance of ~40. In case price breaks below 15, we will get out of this investment and wait until 2nd April to add source for new healthcare sector stock.
#7 – Southern Copper Corporation (Ticker – SCCO in NYSE)
Southern Copper Corporation is a mining company that was founded in 1952. The current incarnation of Southern Copper can be traced to the 2005 acquisition of Mexican copper producer Minera México by Southern Peru Copper Corporation.
75.1 percent of Southern Copper is owned by Mexican mining conglomerate Grupo México. Based on 2007 reserves data, Southern Copper is the world’s largest publicly traded copper mining company and the world’s seventh largest copper mining company based on 2007 sales. In addition, the firm is the eighth largest copper smelting company. The firm ranks among the world’s largest producers of molybdenum, silver, and zinc.
The company is a major producer and refiner of copper, molybdenum, zinc, silver, lead, and gold, and operates mines and smelters in Mexico and in Peru, in the Andes mountains southeast of Lima
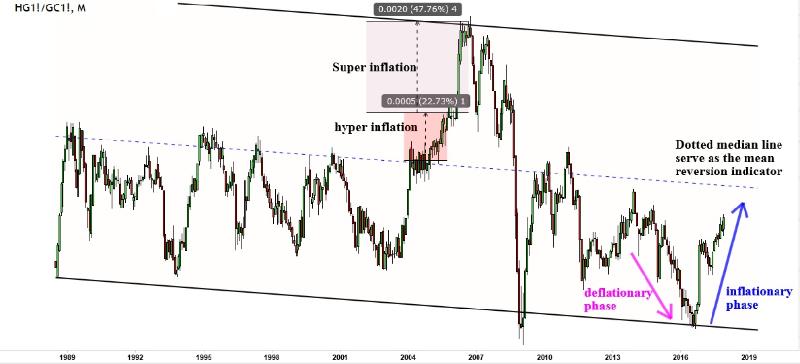
Copper/Gold ratio monthly chart
During a period of inflationary or economic growing stage, the uses of copper outweighs the gold. Copper is durable, highly conductive, coupled with its malleability and resistant to bacteria growth by nature, which gives it a long list of industrial uses including in electrical wires, motors, and plumbing. Gold has a handful of industrial applications too, but its relative scarcity makes it useful mainly as jewellery and money in the form of bricks, ingots, and coins meant to store value. As a general rule of thumb, copper’s rise tends to mean economic activity is improving, or that investors expect it to. Gold can be more idiosyncratic, but it sometimes rises when investors fear turmoil.
This fundamental scenario is in total congruent with the monthly chart of SCCO below. Since the last global financial crisis, price has consolidated in the past ten years forming a massive ascending triangle. Price is attempting to break 49.5 again. Should this third attempt become successful, the upside target will be ~62 while immediate downside support will be ~43
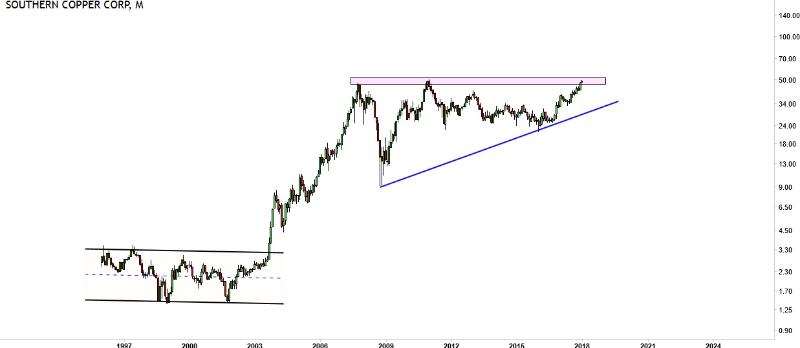
Southern Copper Corporation monthly chart
#8 – AK Steel Holding Corporation (Ticker – AKS in NYSE)
Steel – a key material that is essential for industrialization and urbanization during economic expansion, plays a significant role as a building framework of buildings, infrastructure, tools, ships, automobiles, machines, appliances and so on.
The monthly chart of AKS shows that price can be described in a tilted rectangular channel. Previous consolidation from 2000 – 2006 materialized as an bullish inverted head and shoulder pattern that cause the price to rise up for about one and a half year before collapsing. Since Sept 2011, the same pattern seems to be repeating again. If another inverted head and shoulder pattern is to fulfill, this will be a 7 years of consolidation which if price breaks above the neckline, a parabolic move to the top of channel could happen. The 2018 target will be neckline price of ~10 not forgetting the downside risk of 5.7 and 4.2 respectively if price makes a bearish reversal
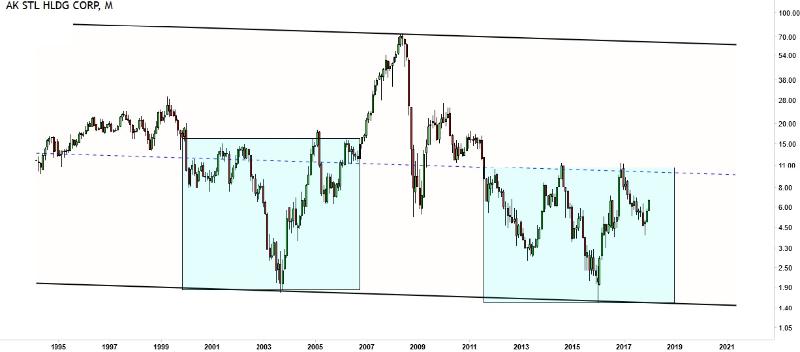
AK Steel Holding Corporation monthly chart
#9 – Exxon Mobil Corporation (Ticker – XOM in NYSE)
Crude oil and other liquids produced from fossil fuels are refined into petroleum products that people use for many different purposes. Biofuels, such as ethanol and biodiesel, are also used as petroleum products, mainly in mixtures with gasoline and diesel fuel. Petroleum products are used to propel vehicles (planes, automobiles, ships and trains), to heat up buildings, and to produce electricity just to name a few. This is the reason an oil stock is included in this portfolio.
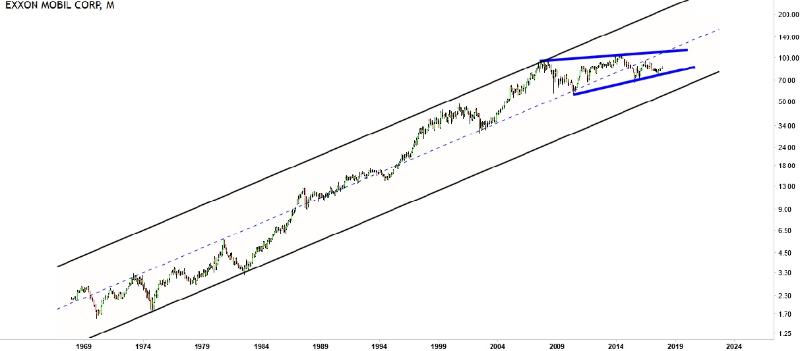
Exxon Mobil Corporation monthly chart
The monthly chart of XOM has a long term uptrend channel where price fits nicely. Since the meltdown of price in 2008 at the top of channel back to median line, price has been consolidating in the triangle (bound by dark blue line). Instead of over projection, we will keep our bullish target at ~94 by 2018 and subsequently ~110 by 2019, that’s provided price has an overall upward move. There is a small risk of price retracing by to ~82 in case correction happens.
#10 – MGM Resorts International (Ticker – MGM in NYSE)
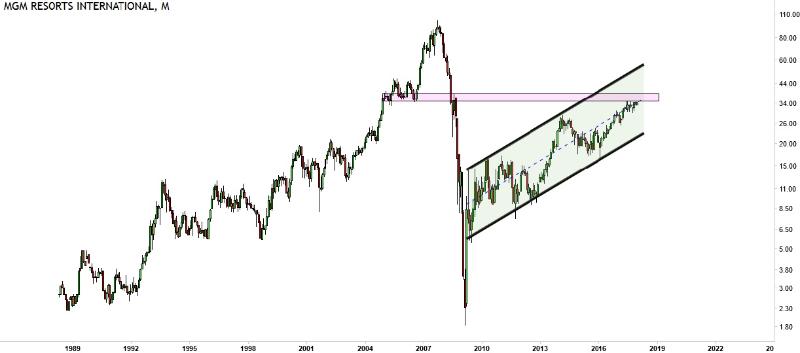
MGM monthly chart
MGM Resorts International is a global hospitality and entertainment company operating destination resorts in Las Vegas, Mississippi, New Jersey and Detroit, including Bellagio, MGM Grand, Mandalay Bay and The Mirage. The company most recently opened MGM National Harbor in Maryland and is developing MGM Springfield in Massachusetts. It has a majority interest in MGM China Holdings Limited, which owns the MGM Macau resort and casino and is developing a gaming resort in Cotai. MGM Resorts owns 50 percent of CityCenter in Las Vegas, which features ARIA Resort & Casino. It has a majority controlling interest in MGM Growth Properties, a real estate investment trust.
Investinghaven foresees another 2-3 years of economic growth down the road, and this cyclical stock MGM fits the bill. During the good time (risk on), people are more willing to spend on luxury hotels and indulge in entertainment.
Monthly chart of MGM shows that price will be heading into a major cross road at 34.80 – 38.50, either it breaks directly with not much resistance or multiple weeks of consolidation before clearing this hurdle. If that is the case, the upside target will be ~47 in 2018 followed by ~56 in 2019. Should the resistance rejects, price could swiftly retraced back to ~31
#11 – HCA Healthcare, Inc (Ticker – HCA in NYSE)
Hospital Corporation of America (HCA) is an American operator of health care facilities. It’s based in Nashville, Tennessee and currently manages 177 hospitals and 119 freestanding surgery centers in the United States and United Kingdom. It is one of the most complete hospitals providing full range of services such as acute and intensive care, accident and emergency care as well as outpatient services just to name a few.
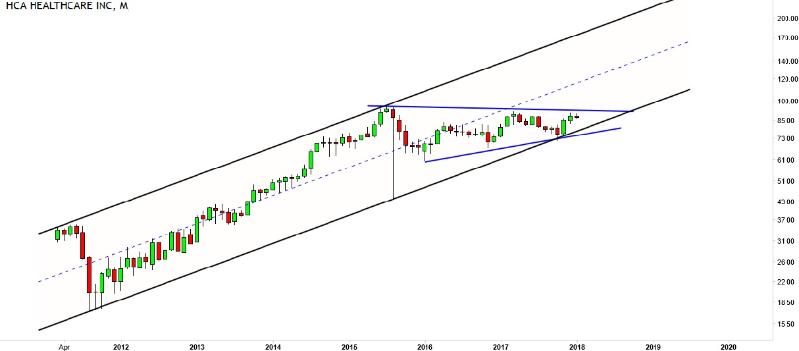
HCA Healthcare Inc monthly chart
Price of HCA has been consolidating in a triangle since the top of July 2015. The 2.5 years of consolidation is setting a stage for price to break on the upside. If the break out materializes, upside target will be previous resistance of ~95 while we do not rule out the possibility of retracing to ~80 should price reverse.
#12 – 21Vianet Group, Inc (Ticker – VNET in Nasdaq)
For investors who want to tap into the infancy bull market of China but cannot access to A-share, the listed ADR stock listed in USA is the next best alternative is to allocate some fund for China-based operation
21Vianet Group, Inc. engages in the provision of carrier-neutral internet data center services. The company also provides hosting and related services; managed network services; cloud infrastructure services; and content delivery network services. The hosting and related services include managed hosting services, interconnectivity services, and value-added services. The managed network services included hosting area network services and BroadEx route optimization. The cloud infrastructure services allow businesses to run their applications over the internet rather than having an information technology infrastructure. The content delivery network services offers solutions to their data connection needs
In October 2016, the company launched IBM Blumix cloud services which are now generally available in China. The deepening partnership will expand IBM’s Bluemix ecosystem in China and fuel Blockchain and IoT innovation besides being operator of Microsoft Azure and Office 365 services in China
The monthly chart of VNET shows the price movement in downtrend channel, but because of the bullish outlook of China as well as the increasing need of cloud-based support, price has bottomed in July 2017 and made a run towards the current major resistance of ~9.22. It could take awhile for price to break this level before heading towards ~20 by end of 2018 and definitely possible to break out of the downtrend channel. The immediate downside is ~8 in case a quick correction happens.
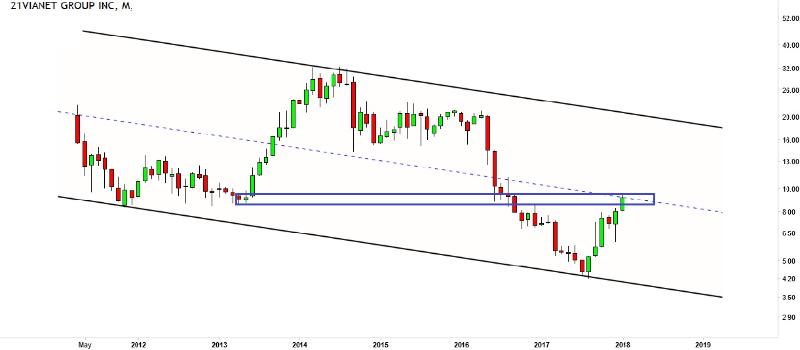
VNET monthly chart
The above mentioned are the selection of 12 stocks Investinghaven team screen out to fit into the budget of 12000 thousand dollar while not fully invested. We allow a buffer of about 20% of the original capital untouched as a safety net in case we want to add on another one or two stocks in the next quarter.
We will see you again on the first week of April with an update of price movements and some review in Part 2.
Disclaimer:
Investment always involve considerable amount of risk, you are advised to seek the opinion and expertise of certified investment manager for your own investment portfolio. This can never be construed as a recommendation to enter a trade.


