
The U.S. dollar has been bearish in 2017. Interestingly, it peaked at 104 points the very first day of this year. Since then it has been in a downward trend, and bottomed in September. Since then, the dollar index gained some 4 percent in value, and touched 95 points last week.
Does this mean the U.S. dollar is bearish, going forward, because it has been negative for 9 out of 10 months this year? Or is its outlook bullish because it has been rising in recent weeks?
In order to answer that question, let’s first go back to the roots: what is the U.S. dollar index.
The U.S. Dollar Index (USDX, DXY) represents a measure of the value of the United States dollar relative to a basket of foreign currencies with the following weight:
- Euro (EUR), 57.6% weight
- Japanese yen (JPY) 13.6% weight
- Pound sterling (GBP), 11.9% weight
- Canadian dollar (CAD), 9.1% weight
- Swedish krona (SEK), 4.2% weight
- Swiss franc (CHF) 3.6% weight
What does this mean? When the US dollar index goes up, it translates into rising strength of the U.S. dollar against the other 6 currencies.
More often than not, there will be a momentarily knee-jerk reaction on the index (up or down) whenever there is an announcement from Federal Reserve’s interest rate decision, non-farm payroll, economic growth, etcK, which is directly dependent on how the consensus interpret these data points. Moreover, even the interest rate decision of other Central Banks could have a substantial effect on the U.S. dollar index.
Given this sensitivity (you can also call it ‘volatility’) of frequently released data, we observe that forecasting the dollar index in the very short term is way too challenging.
However, the historical chart chart of U.S. dollar index, in particular the monthly timeframe, allows for forecasting with a much higher probability.
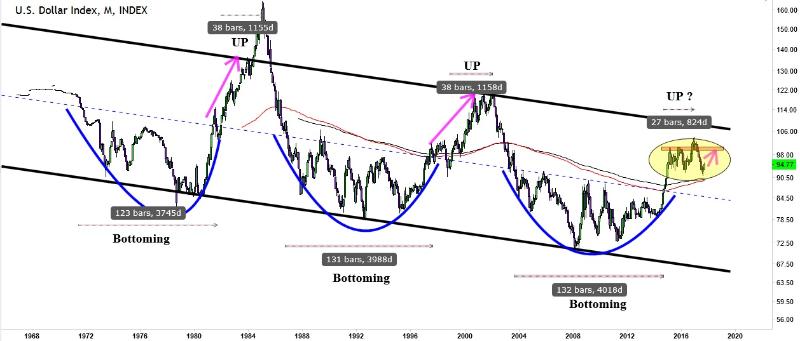
As shown on the above chart it is likely that this index is bottoming out, and will consolidate for about +10 years before a breakout takes place. That could be followed by a super-fast vertical move for at least about 2 years (after which a healthy retracement will follow).
As the U.S. dollar index has risen for 2 years it is currently preparing its next big move.
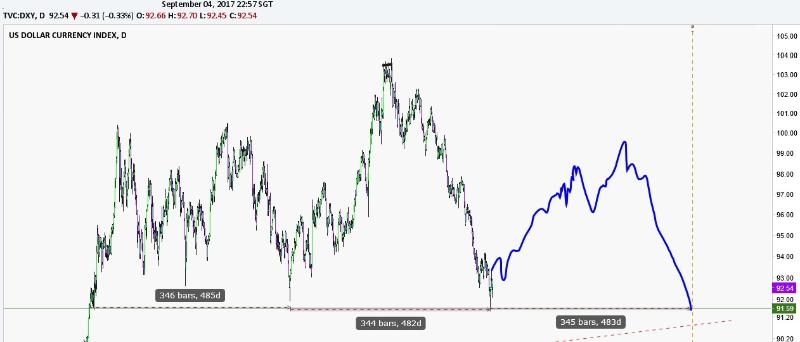
Below charts zoom in on the yellow area (visible on above chart). The dollar index has the intention to make a potential right shoulder. And we got the very near bottom base as expected, see chart below.
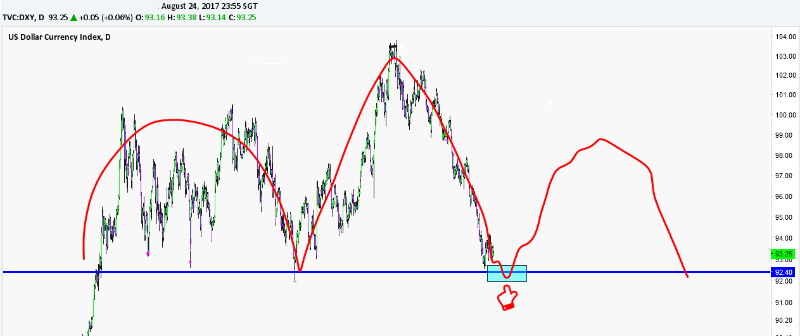
If this cycle materializes as expected then there is a high chance of the dollar index moving towards 99-101 points.
In closing, we want to share some words of wisdom with our readers. Always stay open to any abrupt changes, and adapt your analysis based on new insights and the latest price movements.
Trade based on your own due diligence, do not take our forecast blindly! Don’t forget that the Federal Reverse is well known for spoiling parties in the short term, setting you on the wrong path.


