Crude oil (OIL) looks more bullish as the end of the year is near. Time to let the charts speak, and come up with a crude oil forecast for 2018.
NYMEX WTI Light Sweet Crude Oil futures (ticker symbol CL) is the world’s most liquid and actively traded crude oil contract. It is the most efficient way to trade today’s global oil markets. Not only that, it is also one of the most highly volatile asset that is affected by the outcome of OPEC meeting – whether to cut or increase production, the financial news (see for instance this Reuters crude oil update), weekly Wednesday crude oil inventories report, and the ‘blah’ goes on and on (more examples here and here). There is even fundamental correlation of oil with inflation. With such an enormous amount of noise whispering around us we decided to just filter this out, and focus on what is truly relevant for investors (not traders): the charts on the monthly and weekly timeframe.
Ed. note: Before looking into the specifics of the crude oil 2018 forecast we want to highlight that InvestingHaven’s Crude Oil Price Forecast of this year was quite spot-on. The team expected crude oil to trade within in the 40 to 60 USD zone, which it did. The team also recommended to go long around 40, and that strategy would have yielded great profits.
The weekly and monthly chart for a crude oil forecast for 2018
We always start our analysis in a top-down approach: first the monthly chart followed by the weekly chart. The monthly is a log scale historical chart, and gives a very good sense of the price trend on a high level context.
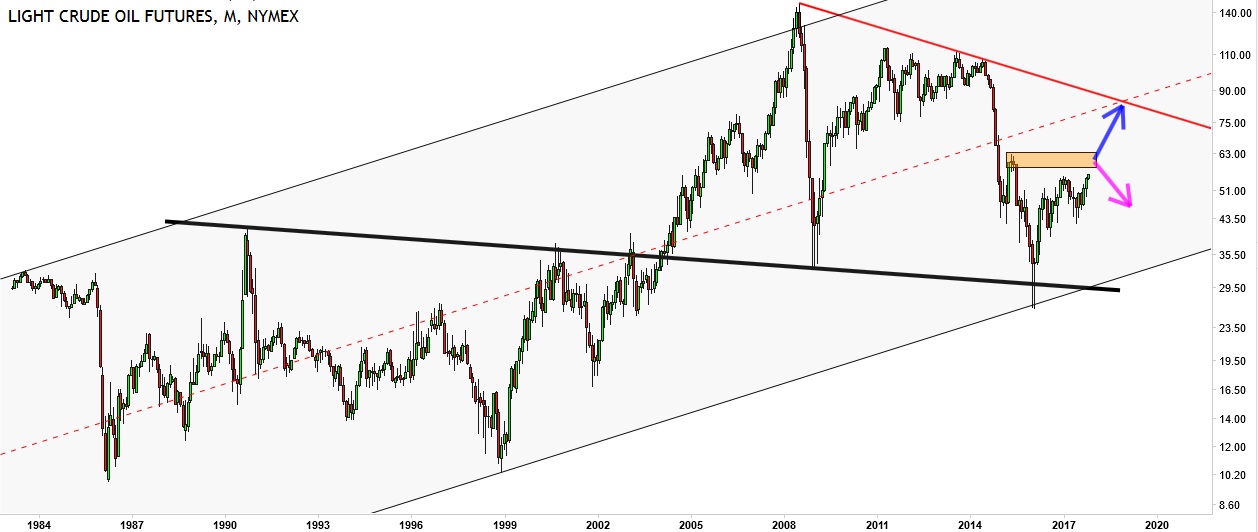
The price of crude oil had been consolidating for 20 years, starting in 1984, before it broke out into a parabolic run all the way to ~ 144. That was the major top which coincided with the collapse with global financial crisis of 2008.
After recovering back to ~111 it started to consolidate in a triangle pattern for +3 years before the excessive outflow of SHALE oil triggered yet another plunge in crude oil price hitting a bottom near 27 dollar. That was a major bottom, and crude oil then started to work its way back to a level between 40 – 55 dollar a barrel.
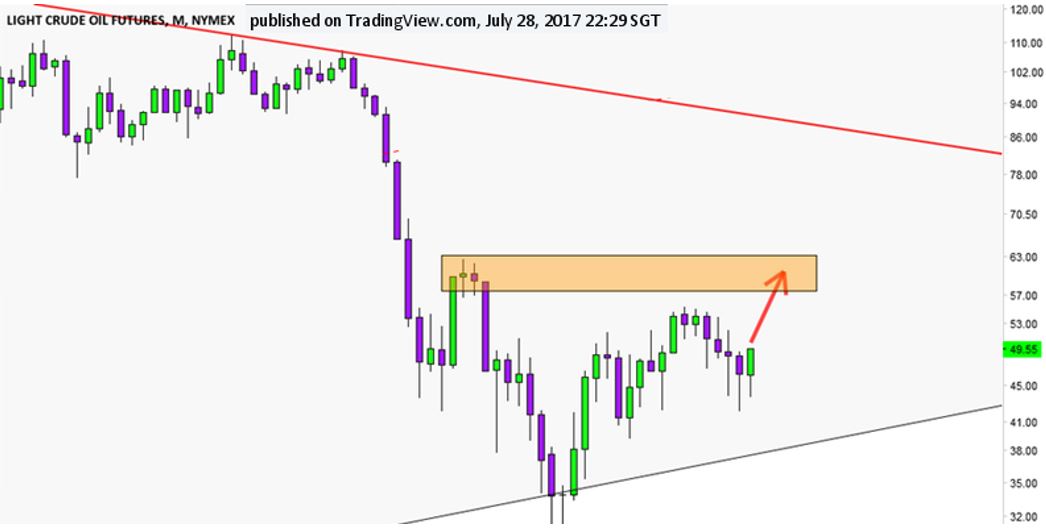
Recently, the InvestingHaven team notified all subscribers on the gradual upwards movement towards 60-61 dollar a barrel, and looking at the current chart, I am personally holding tight to my stance that oil will reach to about 60 – 62 a barrel before deciding its future direction.
We highly suspect that if price of crude oil will achieve 60-62 USD, later in 2018. That is our crude oil forecast for 2018. If that would materialize it would be major news, so stay tuned and stay focused on the charts!
Note: Please bear in mind that there will always be up and down within a general direction or ranging, hence your own due diligence is important too!
Continue reading InvestingHaven’s 2018 forecasts >>


