We look at the silver mining index expressed in the S&P 500. That’s the SIL to SPY ratio. This gives an additional insight on top of the silver mining index chart analysis, sort of a relative silver mining strength/ weakness view. If our silver forecast 2023 will materialize, even partially, we would be looking at an amazing opportunity in silver miners, this is why. Please continue reading about our silver stocks analysis in this comprehensive article: our silver stocks outlook for 2023.
We wrote quite some posts about silver lately, first and foremost actionable insights about the silver price chart, the physical silver market and long term buy signal on silver.
We’ll focus on silver miners in this and subsequent posts, notably Silver Miners To Silver Price Ratio Flashing Long Term Buy Signal and Why Junior Silver Miners Will Have An Amazing 2023.
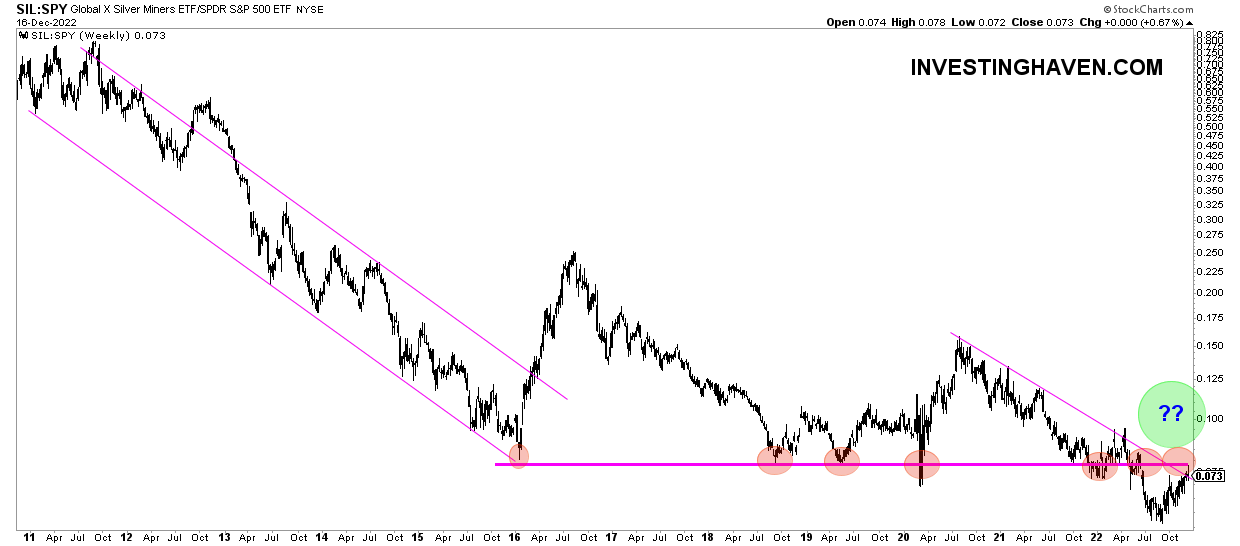
Below is the SIL to SPY ratio chart. It’s a long term chart, going back to 2010.
There are a few findings that attract our attention:
- Every time this ratio chart 0.08 is coincided with an important moment for silver miners. In 2016, it marked the start of an epic rally. Similarly, in 2018 and 2020 it was the start of a strong rally (not as exceptional as the one in 2016).
- Back in 2016, a long term falling trendline was cleared, after hitting the 0.08 level. Today, this ratio is clearing the downtrend that started in August of 2020.
- The current reading of this ratio chart is hitting double resistance: the falling trendline and the 0.08 level. Resistance is and remains resistance until it’s cleared. On the flipside, imagine how much power will be unleashed once this double resistance is broken to the upside.
- Bigger picture, there is one potential scenario that we cannot exclude (we also cannot bet on it): a W reversal that started mid-2016 which concluded the first part mid-2020. IF this pattern is in the making and IF current resistance is broken to the upside, we can reasonably expect a mind-boggling rally in silver miners going into mid-2024 approximately.
Maybe it’s time to start tracking silver miners more closely, just maybe.
The silver mining chart should help us with a buy signal on the sector while individual silver mining stocks might already be in a ‘buy’ area. The ultimate confirmation comes from the SIL to SPY chart convincingly clearing 0.08.
That’s what we are doing in our Momentum Investing service with a special edition on silver and silver stocks shared on Dec 2nd The Silver Market Long Term Very Bullish. Our Silver Mining Top Picks. which is accessible to Momentum Investing members.