As said in our gold price forecast 2019 and as per our 3 long term gold price charts we expect gold to become mildly bullish, best case wildly bullish, going into 2019. Although the price of gold saw a vicious sell-off last week it might be flashing a bullish sign now, this is why.
This is a brief article that focuses on one thing only: gold’s (GOLD) price chart.
Investors may be looking into news headlines to understand ‘why exactly’ gold sold off last week. We wish everyone good luck trying to make sense of gold price related news and deduct any meaningful conclusion for investment purposes.
On the short to medium term what really matters is the chart, in the gold market and in any other market.
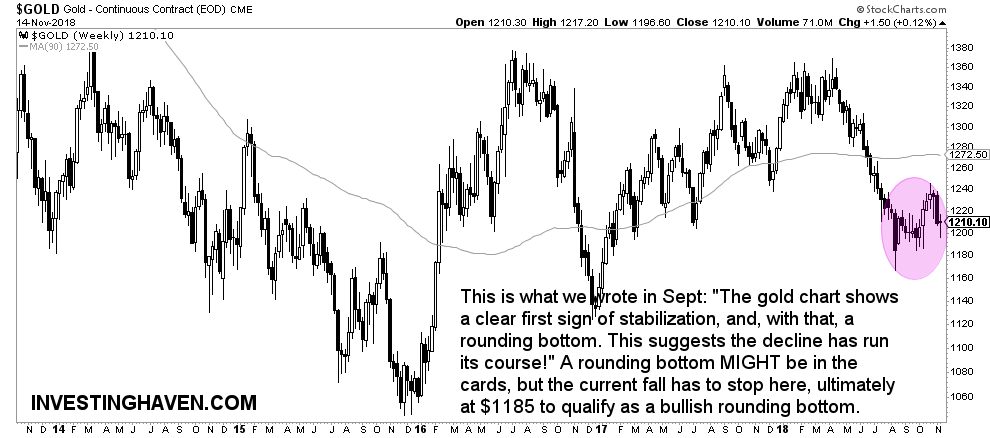
Gold’s chart was looking very enticing until last week when it saw this vicious sell-off from $1240 to $1190. What really happened with this sell-off is very interesting. Not the ‘real reason’ behind this, but the chart formation is the important point here.
As seen on gold’s chart below, in the annotated circle, there is a series of higher lows being set since the lows in August this year.
If, and that’s a big IF, the recent low holds, we see this is a bullish signal.
The odds favor a mildly bullish path for gold, with a temporary spike higher somewhere in 2019. So you might be good holding strong to any gold play at this point in time, as we believe patience will be rewarded.