The price of gold was unstable in recent weeks. Is our gold forecast still underway is the question top of mind of gold investors. Are gold stocks worth buying? Same question related to our silver forecast and silver stocks. There is an additional indicator in April of 2019 that is supportive of our gold forecast to materialize: inflation expectations. Let’s review 3 inflation related charts in this article, only to conclude that gold’s outlook is still great for 2019.
Inflation is a pretty tough concept because of two reasons:
- There are multiple inflation indicators. One ends up asking what the ‘right’ inflation indicator is.
- Gold is sometimes sensitive to inflation, but not always and certainly not only.
So with these 2 remarks we have to be cautious to just select any inflation indicator and jump too fast to conclusions for gold. Stated differently, inflation expectations may or may not act as a leading indicator for the price of gold. And, certainly, CPI is not the only, even not the most important, inflation indicator.
Giant Breakout Of Inflation Expectations In 2019: Will Gold Benefit From It?
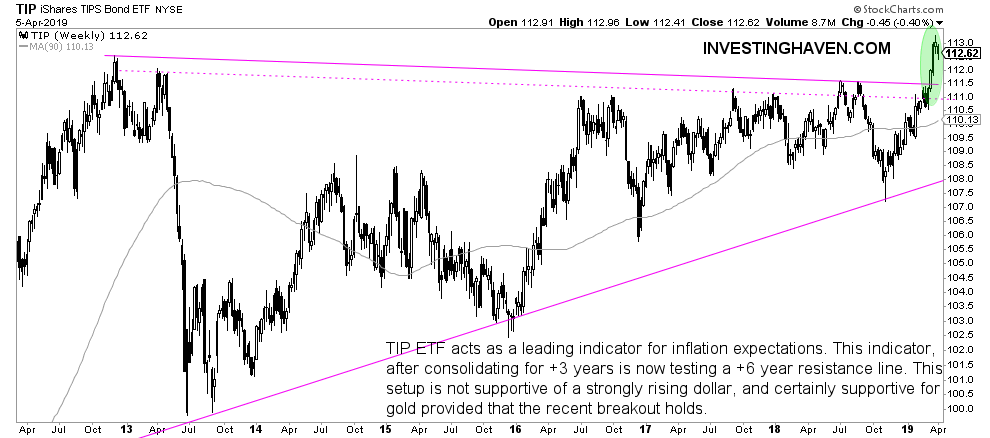
One of the most important chart setups, among the many thousands of charts that InvestingHaven’s research team monitors is the one on inflation expectations. The indicator that is used for this is TIP ETF.
TIP ETF acts as a leading indicator for inflation expectations.
This indicator, after consolidating for +3 years is now testing a +6 year resistance line. This setup is not supportive of a strongly rising dollar, and certainly supportive for gold provided that the recent breakout holds.
Note the giant breakout of inflation expectations on the chart below.
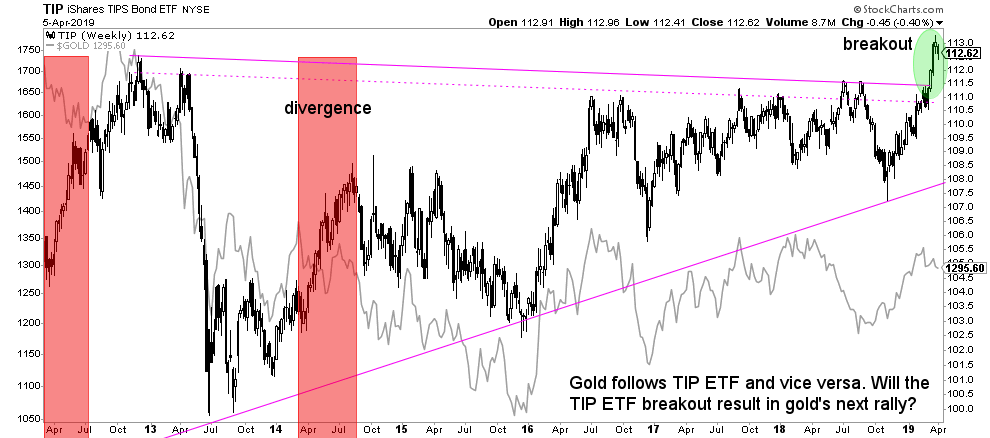
Interestingly, if we overlay the price of gold (light grey line) on the TIP ETF chart (black line) we see a very striking correlation.
In the last 7 years there have been only 2 short time periods of divergence between both TIP ETF and the price of gold. They are indicated in red on below chart.
This chart suggests that if the breakout in TIP ETF holds strong we may expect an upward adjustment in the price of gold anytime soon.
Smart investors monitor the 111.4 price level in TIP ETF!
Last but not least, as we keep the initial remarks which we made right after the introduction we want to broaden our scope of inflation indicators. It does not make sense to only look at TIP ETF as the only inflation indicator.
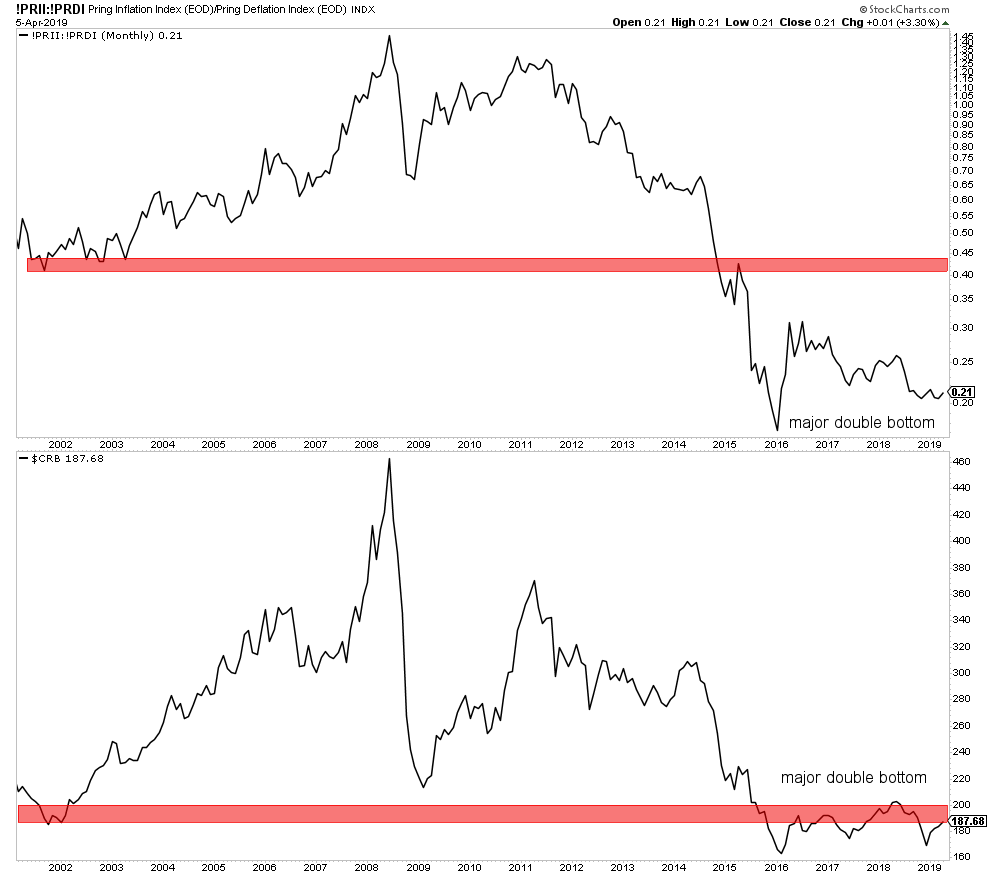
Below are 2 more inflation indicators, in one chart.
First, the Martin Pring inflation/deflation indicator (top panel of below chart) shows a giant double bottom. This certainly is supportive of the conclusions drawn above.
Note that this indicator tracks a different set of data than the TIP ETF. So both should confirm each other for a higher probability conclusion.
Second, the commodity index CRB (loweer panel on below chart) has a similar setup as the other inflation indicator. The giant double bottom, arguably triple bottom, are supportive of rising inflation expectations.
The rationale behind this is that the 2 inflation indicators mentioned below are at rock solid bottoms. Consequently, in terms of expectations, inflation can only go higher, which is what the TIP ETF above suggests!
Hence, with the TIP / gold correlation we expect this environment to be supportive of the gold price.