The gold price chart of 50 years has an outspoken long term chart setup: a rounding bottom. In technical terms this is basing pattern. What makes this exceptional is (1) it took 8 years to complete and (2) gold has a track record of success with this type of long term pattern. This is clearly a long term bullish pattern. The setup on the gold price chart on 50 years is clear: gold is eager to continue to make new all time highs in 2021, after it did so successfully in 2020. We will see $2,200 USD/oz in 2021, the only question is when exactly. In this article we try to forecast when this might happen, and also how. Note that this chart was also featured in our latest annual gold price forecast.
As per Tsaklanos his 1/99 Investing Principles it is 1% of the times that a market undergoes an important ‘event’. In other words 99% of the times a market, as well as a chart, are uneventful.
Think about this.
How many times have you seen charts, and how many times have you been able to figure out those really few but exceptionally important ‘events’ on a chart. The ones that have a high value for investors.
Relevant ‘events’ for investors are visible on the longest possible timeframes. That’s why we pick the gold price chart of 50 years.
That’s where most dominant trend is visible.
By the way if you want to know what the opposite is, ‘uneventful’, then pay attention to financial media. They are only focusing on irrelevant information, just check the Google News ‘gold price‘ news headlines. It’s really, really bad out there. And the worst part is that innocent investors create an absolutely wrong focus. Media is all about writing a lot, in a way it ‘makes sense’ for readers. Markets work fundamentally differently though.
Or what to think of this gold article, or this gold piece? Pay special attention to the fear-triggering headlines, and words like ‘spooking’ and ‘suffering’.
At InvestingHaven we let the important principles and market dynamics reflect in our writings. And if we say that 1% of price points is important, only 1%, we show which those price points are and how to think of them.
The gold price on 50 years has a few of these very important price points, and that’s really it about gold price analysis. All the rest is noise, be careful focusing on noise!
Gold Price Chart Of 50 Years: Giant Rounding Bottom Now Complete
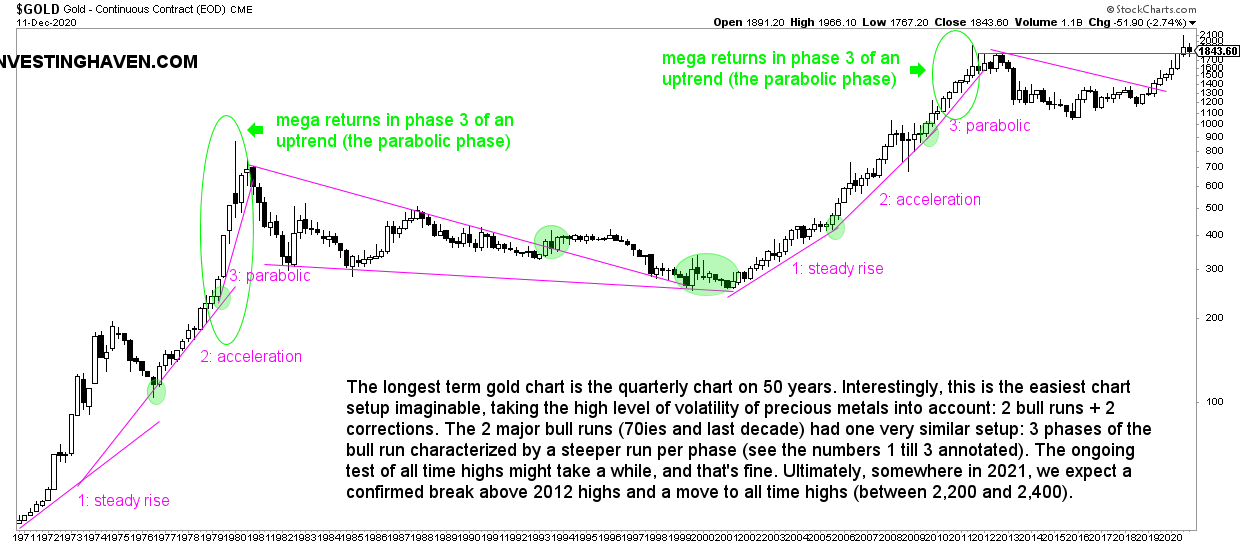
Below is the 50 year gold price chart. It is a quarterly chart. We believe this chart contains a wealth of insights. It is especially useful for our gold price forecast but also to understand the important ‘events’ for investors. Let’s review the insights we derive from this gold chart, and how it is useful for gold investors. We’ll start with the big picture conclusions, those ones that take 5 decades to conclude!
- Gold’s bull markets tend to rise in 3 phases. Each phase is more aggressive in its rise. We saw this twice, once in the 70ies and once in the previous decade.
- The consolidations tend to also have a similar pattern: a rounding formation that ends with a horizontal breakout. We see this once in the 80ies and 90ies, a huge consolidation period of 2 decades, and once in this decade.
- The strong rallies occur a minority of the time, particularly in phase 3 of an uptrend. That’s when most money is made. We saw this also twice, similar to #1.
Currently, at the time of editing this article on Dec 13th, 2020 we see a few pretty interesting things on this 50 year gold price chart:
- Gold has been rising for 6 consecutive quarters (white candles), starting April 2019 till September 2020.
- In the current quarter (Sept 20 till Dec 2020) we see the first quarter in which gold’s price is set to close lower than where it opended.
- Interestingly, the 6 consecutive ‘green quarters’ in gold lead gold’s price from breakout of the rounded cup formation to completion.
- The rounded cup formation took 8 years to complete (2012 – 2020).
Going forward, we can reasonably expect a few quarters in which former highs around 1,900 USD/oz is tested.
We expect gold’s price to pivot around 1,800 to 1,900 USD/oz for a large part of 2021. That’s what this 50 year gold price chart tell us.
2021 Consolidation On Gold’s 50 Year Chart
Note that we are no perma bulls nor perma bears on silver, gold or any other market. It was clear a few years ago that we were bearish on precious metals. We were vocal about it. Now, we are bullish on precious metals because our leading indicators as well as our charts bring a bullish story.
The point we try to make is this: investors want to be invested in markets that are trending higher. It does not make sense to be perma bullish on a market that is flat because you don’t let your capital work. As per Druckenmiller’s investing insights:
The mistake 98% of money managers and individuals make is they feel like they have got to be playing with a bunch of of stuff. And if you really see it, put all your eggs in one basket and watch the basket very carefully.
Gold was bearish and turned bullish in 2020. Period.
2021 will be largely about testing former all-time highs. This will be a slow process, because of the high importance of former highs. The more important a price point, the longer the maturation process.
#gold is in a secular bull market. That's what our exceptional 50 yrs gold #chart says. It suggests a long consolidation around 1,900 USD/oz before making new all time highs later in 2021. A must see gold chart $GOLD $GLD Click To Tweet
How To Play Gold In 2021 and Beyond
With all the points made above we conclude that we have to give the gold market the time it needs. Buy the dips, slowly accumulate whenever gold dips in the 1700-area. The consolidation will be painful for impatient investors.
The classic ‘buy the dip‘ approach applies to gold, as well as silver! And an even more classic saying applies: patience will be rewarded!
This is what we wrote in our latest annual gold forecast for 2021:
InvestingHaven’s research team strongly believes that gold’s dominant trend is this 8-year rounding formation after hitting all-time highs. The bottom of this rounding pattern was reached after 5 years so we expect some 4 to 5 years before gold is able to break out to all-time highs. Consequently we will see a formation of higher lows in 2021.
Moreover, and equally important, we wrote this in our 2021 gold price forecast:
Bull markets accelerate slowly over time, only to accelerate as they mature. With that in mind we predict several spikes in the 2020 and 2021, and in 2021 we expect the first but unsuccessful test of former all-time highs. It might take a year or two before a definite breakout above gold’s former highs at $2,000 is a fact.
We feel very strong that gold’s long term has a clear message, and we are confident about the prediction in this article. ‘Buy the dip in gold‘ in the years to come is what the 50 year gold price chart suggests! By doing this in a disciplined way investors can accumulate gold holdings over time.
Ed. note: Want to know how to play the gold market? We want to catch those big moves in gold, silver and precious metals miners. Subscribe to our free newsletter, and get premium insights. More importantly, for very detailed entry and exit signals in the gold market we recommend signing up to our Momentum Investing service in which we track precious metals very closely and take gold mining positions whenever we see an opportunity (which is once or twice per year).


