One of the markets that have been garnering a lot of attention lately is gold, which is currently trading right below all-time highs. We have covered silver extensively which is why we want to focus on the gold spot chart now. Gold’s chart structure to determine the outlook for the gold market, which is consistent with our bullish gold forecast.
We mentioned two months ago that Gold’s Secular Bull Market Is Resuming. We also said three months ago that Gold Has A Beautiful Chart… it only became ‘more beautiful’ since then.
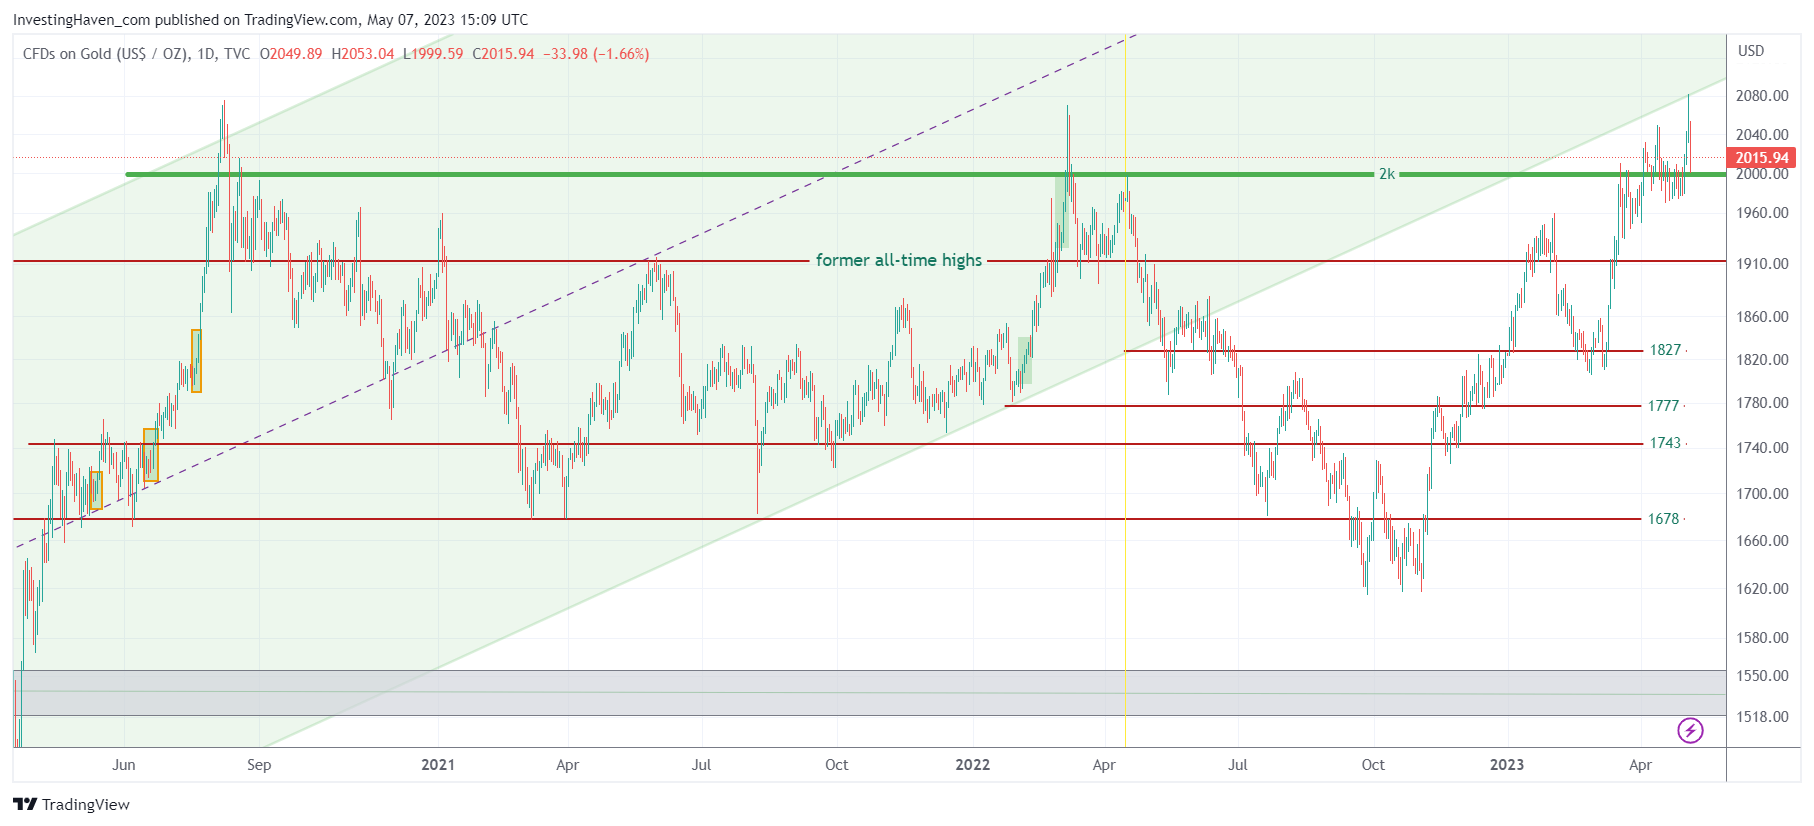
We look at the current gold chart pattern shown on below chart, with our annotations.
Gold continues to work on a long-term bullish reversal, a very powerful double W reversal. The chart clearly shows two distinct W patterns, separated by a small dip. The first W pattern was formed in the second half of 2019, and the second W pattern was formed in the second half of 2020. This formation indicates a bullish reversal, and the fact that it has been able to hold the uptrend since then is a strong indication of continued bullishness in the gold market.
Consider the following:
1/ The current attempt to clear the $2,000 level is very different from the previous two attempts. The previous two attempts were short-lived and had sharp inverted V-type structures that resulted in a sharp selloff. This current attempt is much stronger and is being formed with a solid foundation, which makes it a much more reliable and powerful chart pattern.
2/ The current setup is much stronger than before, with no inverted sharp V-structure. This indicates a much more stable market, with fewer weak hands and stronger support levels. Additionally, the market has been able to hold its ground at higher levels for a longer period, which bodes well for the gold market’s continued bullishness.
3/ This implies that one pullback might be required, though not mandatory, before continued new ATH might be set. A healthy market needs to have some sort of correction or consolidation before it can continue to move higher. Therefore, it would not be surprising to see a soft pullback in the gold market in the near future before continuing its upward trajectory.
4/ Worst case, 1910-1930 might be tested, but we don’t see gold moving lower. Even if a pullback occurs, it is unlikely that gold will move lower than the 1910-1930 level, as there are strong support levels at that range. Therefore, we do not see any significant downside risks for the gold market in the near future.
The gold chart pattern is incredibly strong, and the outlook for the gold market is very bullish. While a soft pullback may occur, the chart structure suggests that the market is in a strong position to continue to move higher, with continued new ATH being set. As a financial markets analyst and chart analyst, it’s essential to remain vigilant and monitor the chart patterns closely to stay ahead of market movements.