Investing Haven
No Result
View All Result
Gold Silver Investing >>
CRYPTO INVESTING >>
  • 2025 Forecasts
    • 10 market predictions
    • Dow Jones forecast
    • S&P 500 forecast 2025
    • Nasdaq prediction 2025
    • Best altcoins to buy
    • Best crypto to buy now
    • Which crypto will explode
    • 15 crypto forecasts 2025
    • Which precious metal to buy
  • Silver
    • Silver prediction 2025 – 2030
    • Will silver exceed $30?
    • When will silver hit $50?
    • Can silver hit $100?
    • Silver shortage
    • 50-year silver chart
    • Silver bullish reversal
    • Silver seasonality charts
    • How to invest in silver
  • Gold
    • Gold prediction 2025 – 2030
    • Will gold set new ATH?
    • Will gold hit $3,000?
    • Can gold hit $10,000?
    • Gold chart 10 years
    • Gold chart 50 years
    • Gold chart 100 years
    • Gold silver ratio
    • Gold seasonality charts
  • Commodities
    • Coffee forecasts
    • Sugar forecasts
    • Nickel forecasts
    • Lithium investing
  • Crypto forecasts
    • BTC prediction 2025 – 2030
    • ETH prediction 2025 – 2030
    • SOL prediction 2025 – 2030
    • XRP prediction 2025 – 2030
    • XLM prediction 2025 – 2030
    • BNB prediction 2025 – 2030
    • ADA prediction 2025 – 2030
    • AVAX prediction 2025 – 2030
    • KAS prediction 2025 – 2030
    • NEAR prediction 2025 – 2030
    • BCH prediction 2025 – 2030
    • LINK prediction 2025 – 2030
    • DOT prediction 2025 – 2030
    • SUI prediction 2025 – 2030
    • ICP prediction 2025 – 2030
    • LTC prediction 2025 – 2026
    • STX prediction 2025 – 2030
    • DOGE prediction 2025 – 2030
    • SHIB prediction 2025 – 2030
    • PEPE prediction 2025 – 2030
    • FLOKI prediction 2025 – 2030
    • WIF prediction 2025 – 2030
    • ONDO prediction 2025 – 2030
  • News
    • Crypto news
    • Commodities
  • Login
Investing Haven
No Result
View All Result

Home » Commodities & Gold » Gold Has A Beautiful Chart

Gold Has A Beautiful Chart

Taki Tsaklanos by Taki Tsaklanos
November 28, 2023
in Commodities & Gold
gold chart
1.9k
VIEWS
Share on FacebookShare on Twitter

Gold (and silver) have been hit hard in February. We predicted a pullback would happen, and we said it would be healthy, sort of a ‘bullish pullback’. We explained this in Gold’s Healthy Pullback Should Improve Its Long Term Profile. While the pullback is still working ‘in full force’ we start seeing how the gold chart is turning beautiful, obviously provided key support levels will hold.

In our Gold Price Forecast 2023 we predicted that “gold will have a strong bullish cycle which will bring gold close to or back above $2,000“. This forecast was published in Oct of 2022, when markets were insanely volatile and the entire world was convinced that an epic recession was imminent. In a way, our 2023 prediction is already hit.

We also wrote:

We strongly believe that gold’s dominant trend is long term bullish. However, with monetary policies being restrictive as 2023 kicks off creating a disinflationary trend, we see gold consolidating in 2023 before hitting new ATH at a later point in time.

In the end, that’s what matters, the long term trend. We are investors, not traders.

But the point we are trying to make is that we believe that gold will re-attack 2000 USD/oz, still this year. It might take several months, maybe a few quarters, but gold is expected to consolidate before moving back higher.

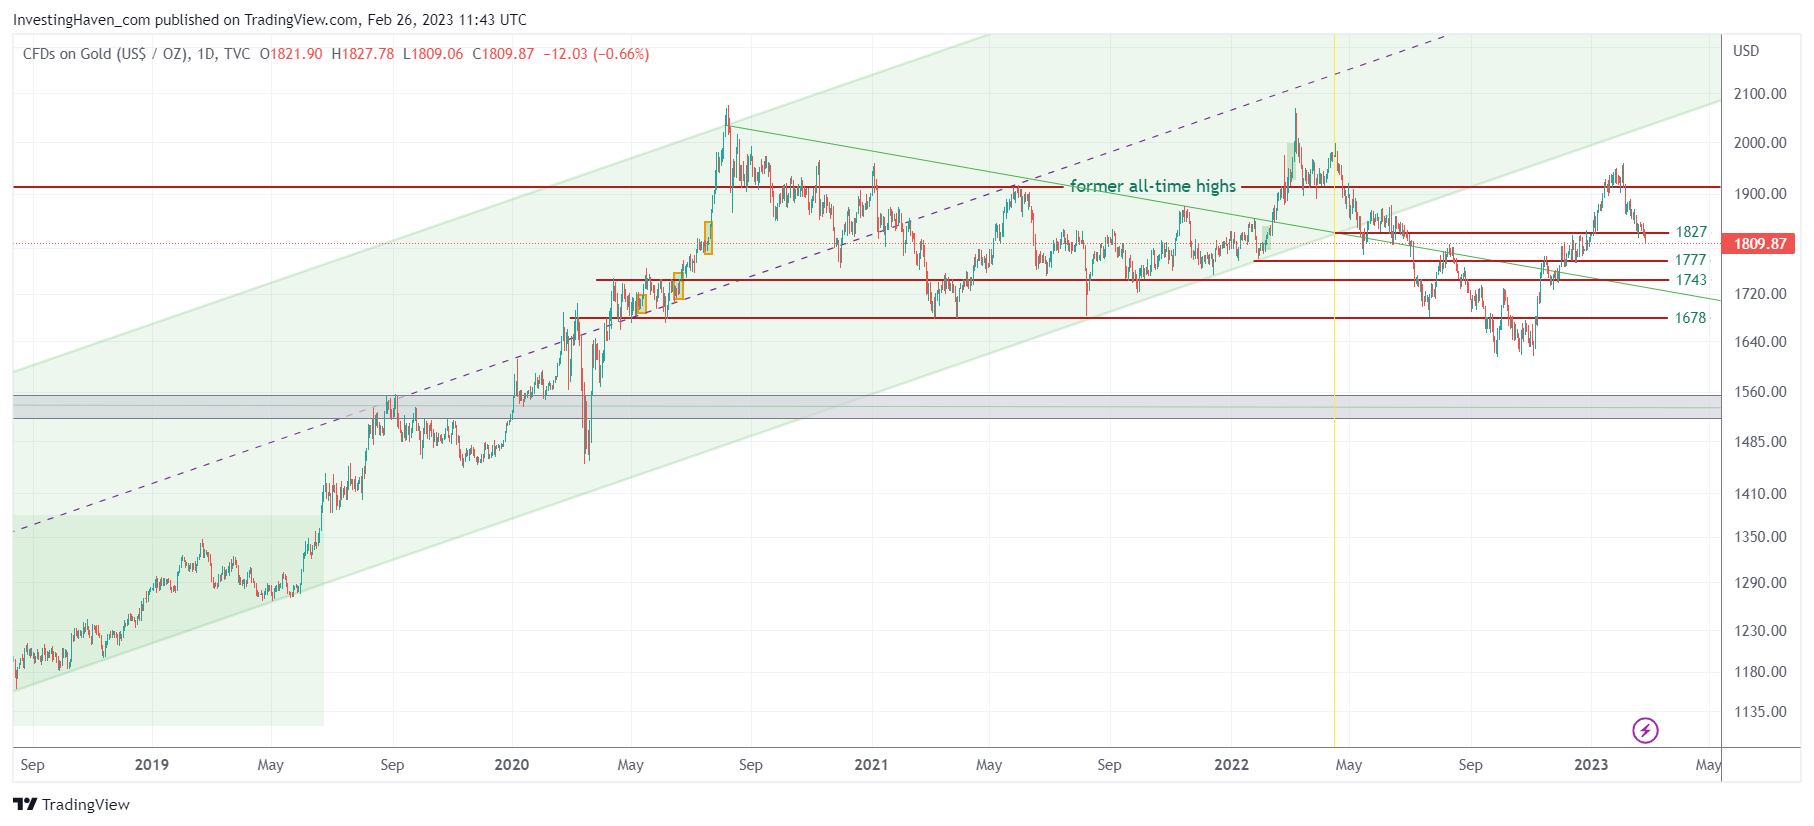
The long term gold chart makes that point, in our view, provided 1743 is going to hold on a 5 day closing basis.

This is in line with what we explained in Gold: Close To Decent Support Levels:

If the last point is what the market is working on, then you can be sure that support level 1777 and the green falling trendline will hold. In that scenario gold will move back to 2000 USD/oz and clear that level, in the 2nd half of 2023.

That’s what we continue to see: a nice consolidation in the context of what is becoming a giant consolidation, the one that started in Sept of 2020.

So, when your eye is focused on the long consolidation, as seen on below chart, the gold chart turns beautiful. We’ll stick to that beautiful view, it will invalidate if and when gold falls below 1678 USD/oz for more than 5 consecutive days.

Until then, we are long term bullish gold and super bullish silver.

RECOMMENDED READING: Silver: 4 Structural Changes That Confirm The Start Of A New Secular Bull Market.

gold chart

10-YEAR ANNIVERSARY OFFER: InvestingHaven.com celebrates 10 years. Temporarily, you can enjoy a discount on our premium gold/silver and crypto reports. Or you can become a VIP member. Go to our anniversary deals >>
Receive our weekly newsletter.

premium service SP-500 premium service trade alerts premium service crypto teaser 

No related posts.

Tags: GOLD
Taki Tsaklanos

Taki Tsaklanos

Taki has +15 years of experience in global markets. He is passionate about forecasting markets - he calls it THE ART OF FORECASTING. His analysis methodology is unique and effective, yet easy to understand; it is based on chart analysis combined with intermarket / fundamental / sentiment analysis. His work appeared on major financial outlets like FinancialSense, MarketWatch,Twitter: twitter.com/investinghaven

Connect with InvestingHaven

Receive top notch forecasts for free.

*We hate spam as you do.

Site Navigation

  • RSS Feed
  • About us
  • Advertising
  • Sponsored Content Policy
  • Mission 2026
  • Sitemap
  • Privacy & Disclaimer
  • Terms of Service
  • Contact Us
investing haven logo

Precious metals market analysis including gold and silver price predictions. Crypto market analysis including highly accurate BTC ETH SOL XRP forecasts.

Copyright © 2025 InvestingHaven

Login to your account below

Forgotten Password?

Fill the forms bellow to register

All fields are required. Log In

Retrieve your password

Please enter your username or email address to reset your password.

Log In

Receive top notch forecasts for free.

*We hate spam as you do.

No Result
View All Result
  • News
  • 2025 Forecasts
    • 10 market predictions
    • Dow Jones forecast 2025
    • S&P 500 forecast 2025
    • Nasdaq prediction 2025
    • Best crypto to buy now
    • Which crypto will explode
    • Best altcoins to buy
    • 15 crypto forecasts 2025
    • Which precious metal to buy
  • Silver articles
    • Silver prediction 2025 – 2030
    • Will silver exceed $30?
    • When will silver hit $50?
    • Can silver hit $100?
    • Silver shortage
    • 50-year silver chart
    • Silver bullish reversal
    • Silver seasonality charts
    • How to invest in silver
  • Gold
    • Gold prediction 2025 – 2030
    • Will gold set new ATH?
    • Will gold hit $3,000?
    • Can gold hit $10,000?
    • Gold chart 10 years
    • Gold chart 50 years
    • Gold chart 100 years
    • Gold silver ratio
    • Gold seasonality charts
  • Commodities
    • Sugar forecasts
    • Coffee forecasts
    • Nickel forecasts
    • Lithium investing
  • Crypto news
  • Crypto forecasts
    • BTC prediction 2025 – 2030
    • ETH prediction 2025 – 2030
    • SOL prediction 2025 – 2030
    • XRP prediction 2025 – 2030
    • XLM prediction 2025 – 2030
    • BNB prediction 2025 – 2030
    • ADA prediction 2025 – 2030
    • AVAX prediction 2025 – 2030
    • KAS prediction 2025 – 2030
    • NEAR prediction 2025 – 2030
    • BCH prediction 2025 – 2030
    • LINK prediction 2025 – 2030
    • DOT prediction 2025 – 2030
    • SUI prediction 2025 – 2030
    • ICP prediction 2025 – 2030
    • LTC prediction 2025 – 2026
    • STX prediction 2025 – 2030
    • DOGE prediction 2025 – 2030
    • SHIB prediction 2025 – 2030
    • PEPE prediction 2025 – 2030
    • FLOKI prediction 2025 – 2030
    • WIF prediction 2025 – 2030
    • ONDO prediction 2025 – 2030
  • Premium Crypto Alerts
  • Premium services

Copyright © 2025 InvestingHaven