
Gold price had a disappointing performance so far considering the strong uptrend in most commodities. It significantly underperformed its peers. As we write this article, there is a valid possibility that Commodities are reaching a top. There is also an extremely strong possibility that the US Dollar’s uptrend is exhausted. More interestingly, there is a strong possibility that our bullish gold forecast 2023 is ‘on track’ to materialize.
How this current market anomaly (commodities and the US dollar rising and topping concurrently) will affect the price of Gold is unknown. However, we see some clear price levels and patterns investors need to know in order to catch the uptrend in Gold or exit should this setup get invalidated.
Before we get into price levels and charts, here is a short excerpt of InvestingHaven’s annual Gold forecast in 2022:
We predict gold’s price could rise to $2,500 area in 2022. Our 2022 forecast is strongly bullish but we need the USD to first run its course before gold can accelerate. We believe gold will accelerate mid-2022.
Gold price setting up in an extremely bullish chart pattern
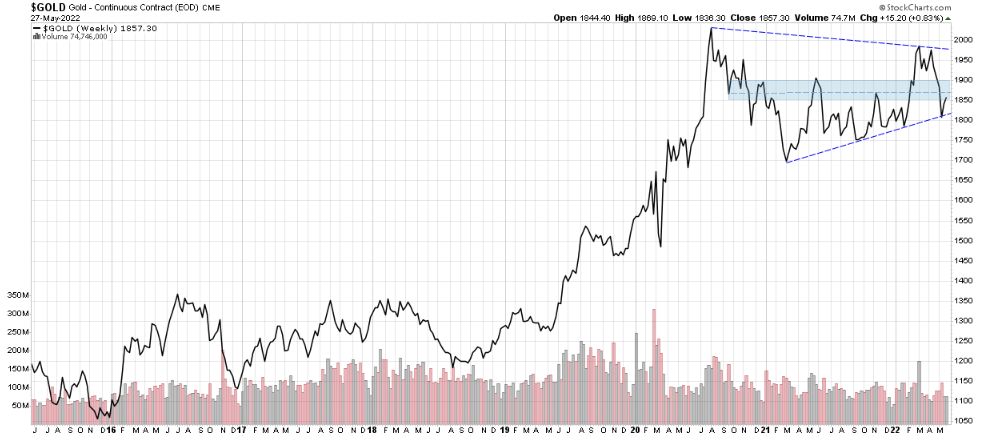
The chart below shows a bullish symmetrical triangle. After a consolidation that lasted for a few years, we had a strong leg up in the price of gold that started early 2019 and peaked late 2020. This triangle is a continuation pattern and if the price breaks out to the upside from here, a conservative target is actually $2700.
From an intermarket perspective, we have a weakening US Dollar which should help push Gold’s price up. We also have commodities as an asset class facing overhead resistance. So the price could still breakout either way however, we maintain a bullish bias given the chart setup and potential US dollar weakness.
Gold price levels to watch for a breakout or a break down
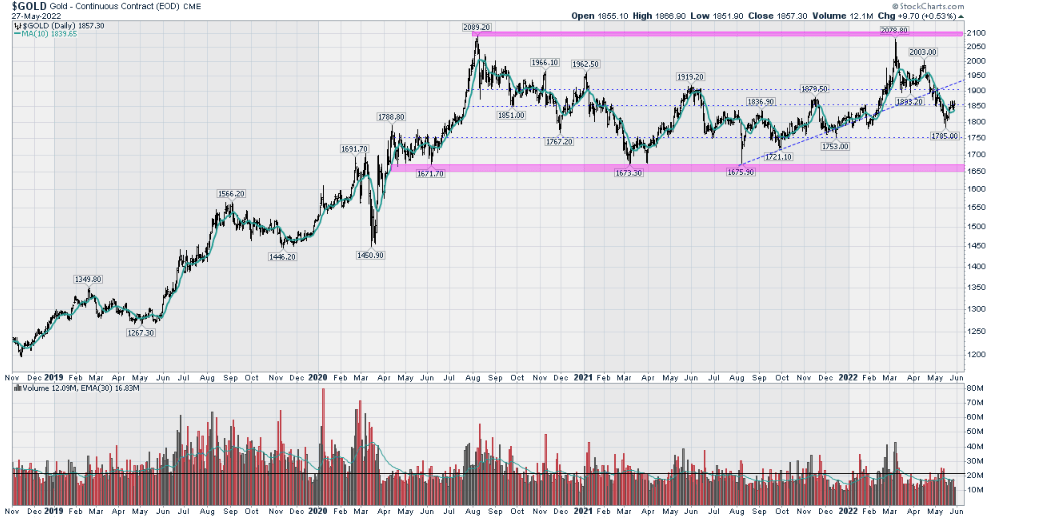
Since the support at $1800 held, $1850 to $1900 is the first resistance area. Once that’s cleared, crossing above $2000 signals the start of a breakout.
Gold price’s real breakout will happen once the price breaks and holds above 2100. Setup invalidation below $1750.
Why is the $1750 to $1800 area crucial for Gold?
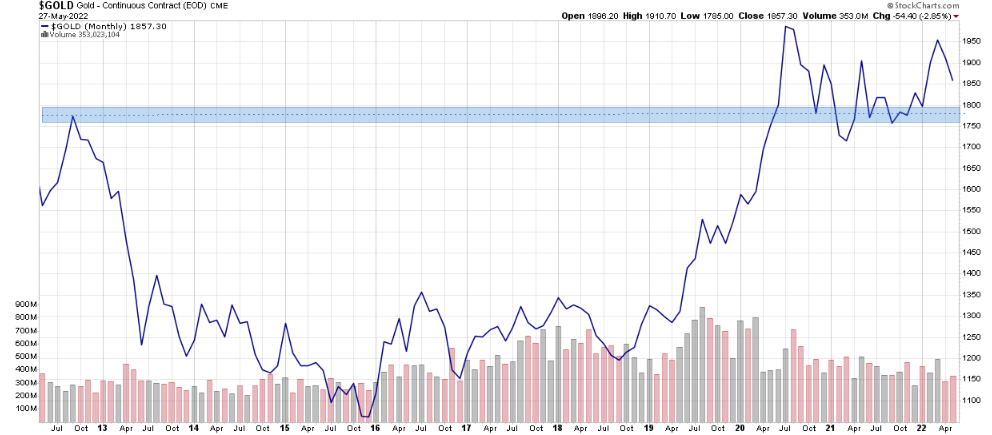
The reason why this support level is crucial can be seen clearly in the chart below. That level was the top from 2012 and if it holds, we have a solid base that can send gold prices higher in the second half of 2022. In fact, every time the price revisits that area and it holds, we have a successful back test of that important breakout level.
Written by hdcharting, reviewed by Taki Tsaklanos


