“Gold tested ok” is how we would describe this week’s gold price action. As explained in the Corona crash update in our gold forecast we want to see this 1557 level hold strong. That’s what happened this week, and it’s the one and only feature that stands out in the gold market at the time of writing.
Gold’s daily chart from the last 7 months has a lot of volatility, but in the end is near range bound.
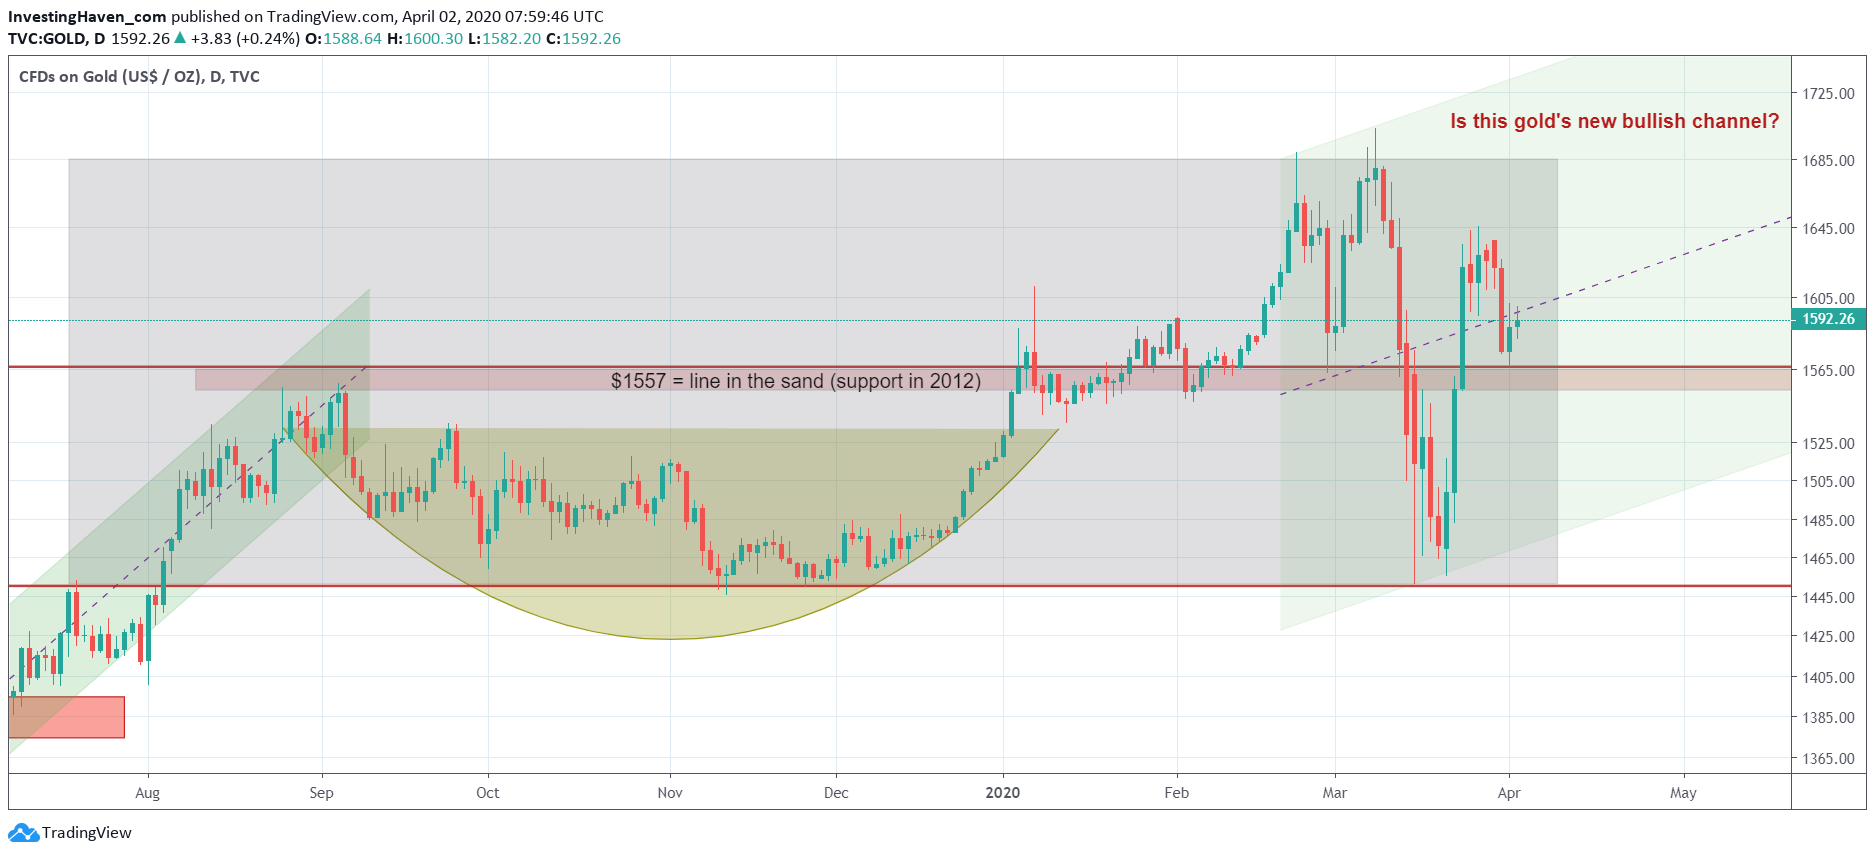
Gold has been moving between 1450 USD and 1685 USD for 7 months in a row. Interestingly in March during the Corona crash(es) gold moved from the top to the bottom of its consolidation area within 2 trading weeks.
We consider this to be a ‘validation’ of the consolidation. Even though the volatility was hard to stomach, and it created serious damage among gold miners, we believe that the gold markets is still in a good shape. More importantly it has a great outlook for the remainder of 2020!
As per below gold price chart we conclude that this week’s 1557 USD touch was a greatly successful test. We can’t help to see a good outcome on this chart, presumably the light green rising channel is the path for gold in 2020 and 2021.