The palladium price crash (PALLADIUM) of 20 pct in the last week of March was really aggressive. Based on the current state of things it seems our palladium forecast of $2700 is invalid for 2019, it may materialize later. There is one wildcard though: the quarterly chart of palladium. It is for now diverging from the lower timeframes. What does this mean? Moreover, as There Is Always A Bull Market In One Of The 4 Precious Metals is it worth considering another metal?
We noted in the palladium price crash article that the damage on the monthly chart was significant. Palladium broke down below its tacticaly rising channel, and pierced into the lower band of its secular channel.
This is _not_ good, unless it recovers very fast. It does not seem very likely though.
One additional data point we looked at is the highest timeframe of palladium’s chart set: the quarterly chart.
Remember, as per our 100 investing tips, the higher the timeframe the more dominant trend.
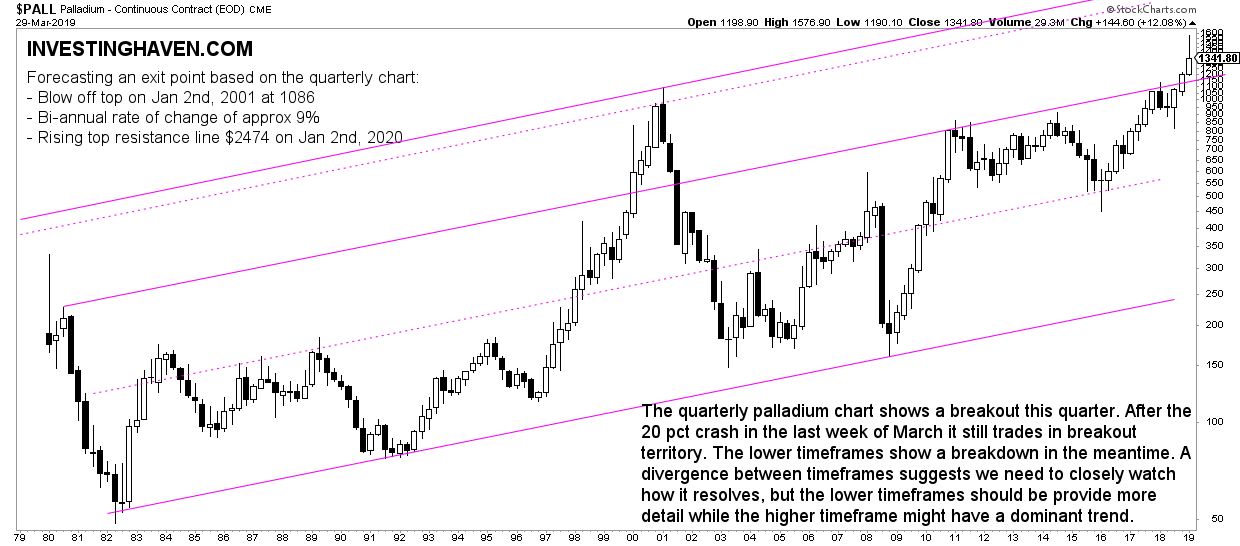
Palladium: The Message Of The Quarterly Chart
The quarterly palladium chart shows a breakout this quarter (ending March 31st 2019). After the 20 pct crash in the last week of March of 2019 it still trades in breakout territory.
As said, the lower timeframes show a breakdown in the meantime. A divergence between timeframes suggests we need to closely watch how it resolves. The lower timeframes should be provide more detail while the higher timeframe might have a dominant trend.
Which Precious Metal To Invest In
As per our finding that there is always a bull market in one of the 4 precious metals the question becomes: which of the 4 to invest in.
Our gold forecast (GOLD) will become very bullish if and when gold pierces through $1375 and stays there for 3 consecutive weekly closings. This is the 5 year old bear market wall we want gold to break, it is not an easy task. It may take a bit longer than expected even though the picture looks quite good right now. We need to wait and see for now.
Our silver forecast (SILVER) will follow gold, as gold is the leader of the two in the current stage of the precious metals market evolution.
The wildcard is platinum (PLATINUM). It is bottoming, clearly, but does not show signs of breaking out as of yet. The line in the sand is $875. We might see capital flowing out of palladium into platinum, but we need to see a confirmation of the breakdown of palladium first.
In other words, we need more data in terms of price changes before we can conclude. An inconclusive situation is just that: inconclusive. Investors should not force any decision if the picture is not crystal clear.