Exactly 4 more months ago we wrote our Palladium Price Forecast for 2021 in which we pinpointed March 15th, 2021 as a decision point. We are following up on our palladium forecast, and try to understand what 2021 will bring.
One of our followers wrote this note last night:
“I’m very interested in the PGMs and the lingering structural deficit in Palladium in particular, so I would be really keen to hear what you think about the 2021/2022 Palladium price given the current highs of almost $2,700.”
Before looking at the charts we will start with our assessment on December 13th, 2020, when we wrote our palladium forecast (link).
This is one quote (high level summary, top of the article):
Our palladium forecast for 2021 has a bearish bias as we expect $2,350 to act as resistance. March 15th, 2021 is a very special date, this is why.
This is the other quote (summary, end of the article):
How to read this: if palladium falls below 2,000 after March 15th, 2021, we will see much (MUCH) lower palladium prices in 2021. The opposite is true as well: if palladium breaks above this bearish topping pattern, which is $2,350 (our pivot point for 2021) it will continue to be bullish, especially if it also succeeds in staying above $2,500.
How much more accurate could we have been?
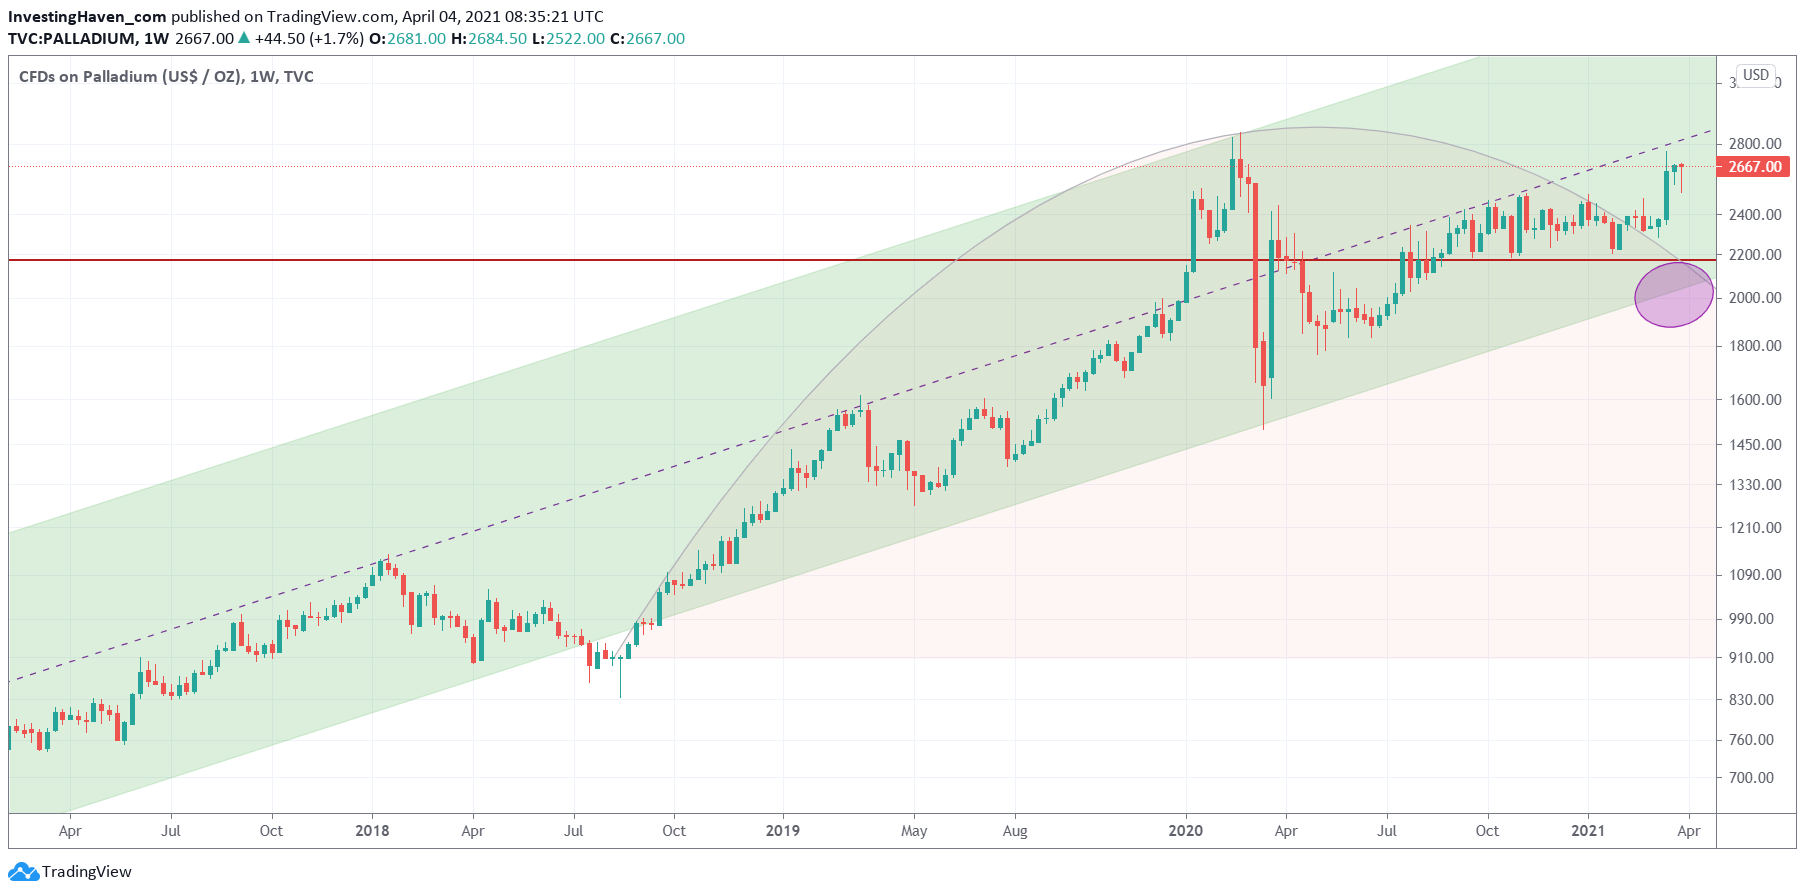
Note that all charts we used in this article are exactly the same charts we created early December, 4 months ago. Especially the patterns, like the rising channel and the rounded pattern, are the ones we created back then and did not touch it since then!
The weekly chart shows a decisive move higher … in the week of March 15th, 2021. The big green candle on the weekly chart is the one that confirms the bullish decision of this market.
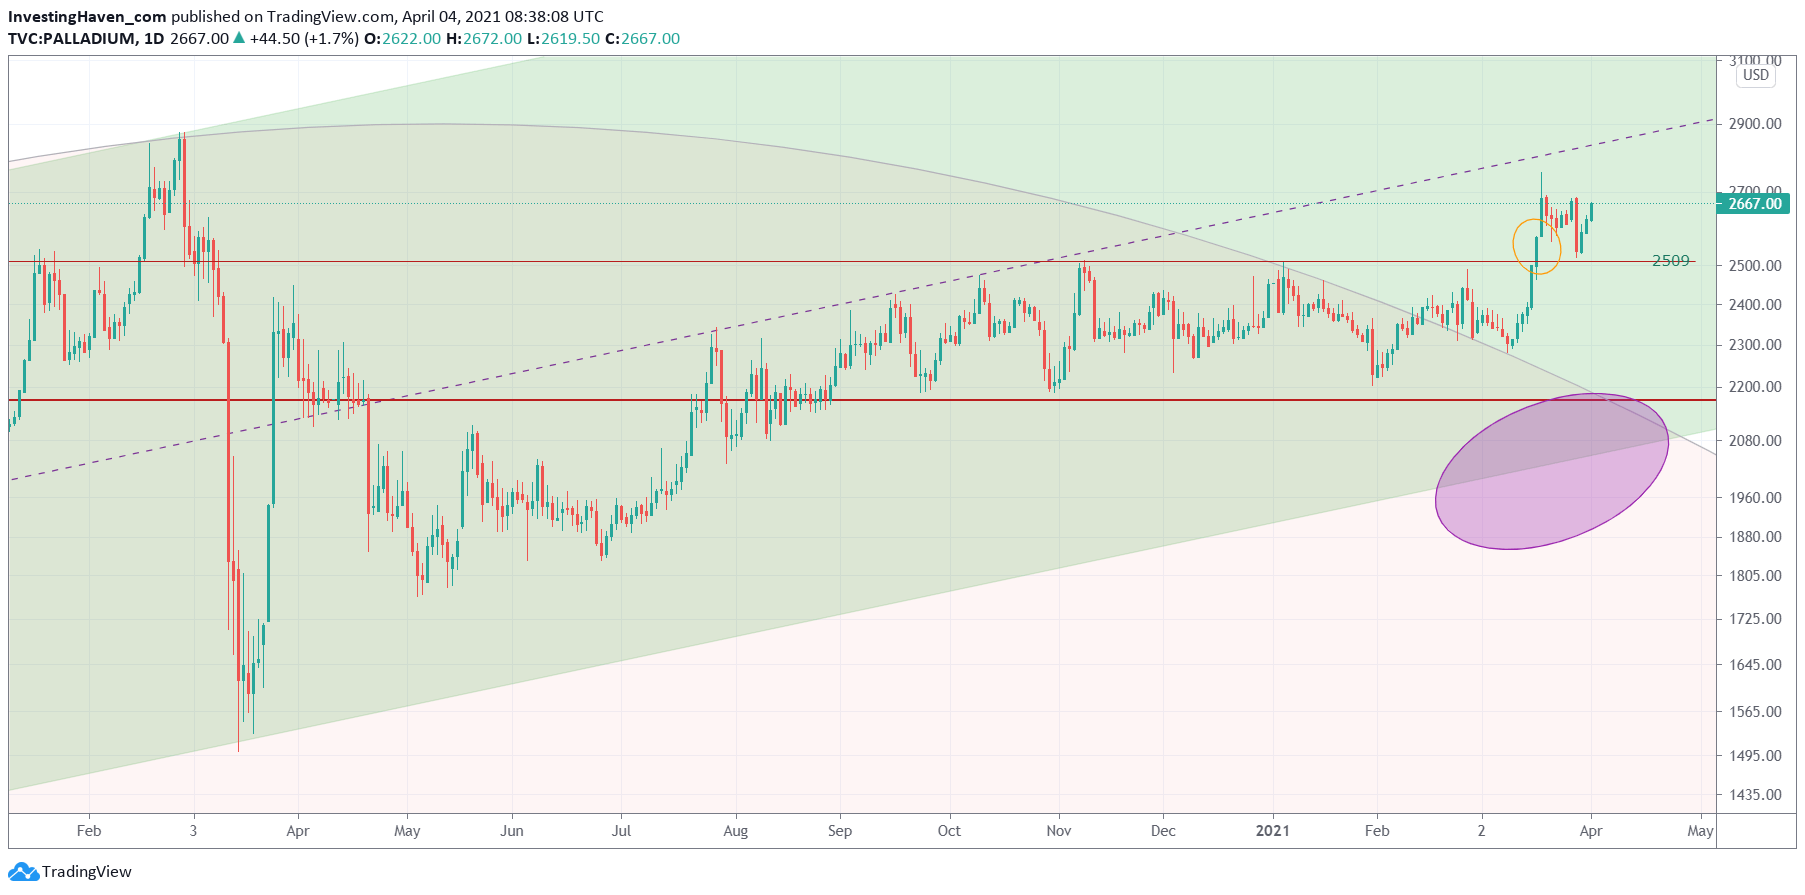
The daily chart shows how palladium climbed above the rounded bearish pattern near the end of January, flirted with the rounded pattern between February and mid-March, only to push higher … around March 15th, 2021.

In order to understand what palladium wants to do now we need a close up of the daily chart above, which is the one we show below.
The 2599 USD level is the one that is important to us. It is the ‘line in the sand’ for a strong bull market. It also is the point where palladium gave up, last year February, when the Corona crash hit. Palladium broke out above 2599 USD on March 17th, 2021, and successfully tested it again a few days before the start of April.
These charts suggest that palladium (a) wants to move higher (b) is moving to its first target which is the median line around 2900 USD, also former ATH (c) it has a higher probability of moving higher because of its 7 month consolidation period.
The real spectacle will happen once palladium crosses its median line. We need to assess the pattern that it creates between 2599 USD and the moment it is going to touch its median line to understand if palladium will be able to move to the top of its current long term channel (in green on above charts).
We did not take a palladium position in our Momentum Investing portfolio. We might consider a palladium miner, but the problem is there are hardly any pure play palladium miners out there. We continue to research this space to find miners in the fields of mining stocks, both strategic mining stocks as well as precious metals mining stocks like platinum and palladium.


