As per our silver price forecast 2019 we believe the silver market has extreme readings, both on the silver chart as well as in the futures market. We believe the price of silver will recover. With this must-see silver chart we believe silver in the future will look better than today. However, more than ever, it is imperative that silver’s price respects current support. That’s another reason why this is a must-see silver chart which is telling about silver in the future.
One important tip that every investor must always remember is to not be dogmatic about any outcome. Moreover, it does not pay off to be a perma bull nor perma bear in any market. We certainly have preferences, we also have emotions, but never should preferences nor emotions become the primary decision making factor. This applies to the silver market as well. InvestingHaven may have a strong opinion that circumastances in the silver market look bullish for the longer term but the chart suggests that we have to be careful as the opposite may happen as wel, i.e. a giant breakdown. That would significantly impact our view on silver in the future.
Silver In The Future
Believe it or not, inflation is in the air. At the same tame we are likely in a new era in markets, as we just concluded the End Of 40-Year Bull Market In Bonds, a major market pivot point.
Let’s look at both major events which may impact silver in the future. What we are saying is that we look silver in the future based on how markets evolve over time and influence each other, also known as ‘intermarket dynamics’, one of the focus areas of InvestingHaven’s research team.
First, as shown in great detail in our inflation forecast for 2019, we have checked several inflation indicators, and they all suggest as a base case mildly rising inflation and, potentially, strongly rising inflation. We shared several price points and chart which readers can monitor themselves to understand how strong the inflation becomes, one of them being TIP ETF (above 106 points suggests ‘inflation is in the air’ while above 112 is a clearly rising inflation trend) and another one the AUDUSD currency index (above 0.725 suggests ‘inflation is in the air’ while above 0.825 suggests rising inflation).
Our viewpoint in the bigger scheme of things is this. Based on the correlation between the gold chart and the leading inflation indicator there is a relatively strong positive correlation on their high level direction. Primarily secular double bottoms and double tops seem to be a reliable indicator and ‘catalyst’ for precious metals. After inflation’s giant double bottom of 1999/2001 and giant double top of 2008/2010, it might be setting up for a giant double bottom in 2016/2018!
If, and only if this giant double bottom in the inflation indicator comes true, will we see a new trend of stronger inflation than in the last 7 years. This would be favorable for silver in the future!
Second, when it comes to the new era of rising U.S. yields, it is a pivotal evolution for markets.
As per Forbes the end of the 40-year bull market in bonds will have major implications, unsurprisingly. However, this is really one of the few articles that we like, really. It is the 1% that is worth reading and reflecting on. This is a crucial quote in there:
The failure of getting inflation to rise over the past eight years has thrown a monkey wrench into the central bank strategies of the last 60 years. The game plan was to create long-term inflation, in order to reduce the real governmental debt outstanding, and diminish the real size of that debt mountain. In other words, inflation was the silent tax on individuals. However, nothing is forever. A huge trend change could be starting now. Central bankers will cheer and encourage that trend. A cheaper dollar will be one of the goals.
Pay special attention to the last sentence, in bold (emphasis ours).
What we are saying is that both the inflation indicator as well as the new trend of rising interest rates (on a long term scale) will both be favorable for silver. The future of silver might be better than what most think. However, both trends explained in this section must continue in order to validate our assumption.
A Must-See Silver Chart: Silver In The Future Bullish only if Support Holds
What the above mentioned 2 trends mean for the price of silver is clear: higher prices in the air.
However, the silver chart is at a critical juncture, and cannot diverge from our thesis outlined above.
First and foremost, it is an absolute must that current silver price support holds strong! Only if and once current support holds will silver in the future be bullish. The silver chart below makes our point. The structure that was set since January 2016, indicated as phase (4) on this chart, will only be valid as long as the Jan 2016 lows hold. Silver is now trading exactly at those lows.
If, and that’s a big IF, current support in silver breaks down, we may be looking at the continuation of the pattern of phase (3): a falling channel that may bring silver to the $11 area before it stops falling.
We do not expect, nor do we anticipate, this will happen. But never say “never” in markets.
As long as silver continues to trade above $14, and does not fall for more than 3 to 5 consecutive days below $14, we believe phase (4) shown on the chart is in play. This implies the start of a new consolidation and bullish structure. We have annotated the most likely rising channel that will arise, see the green dotted lines. This new channel, if and once phase (4) is confirmed, is additional evidence that our price target of 21 USD in 2019 is not far-fetched.
We take things step-by-step though, and monitor closely silver’s performance around the super critical $14 area.
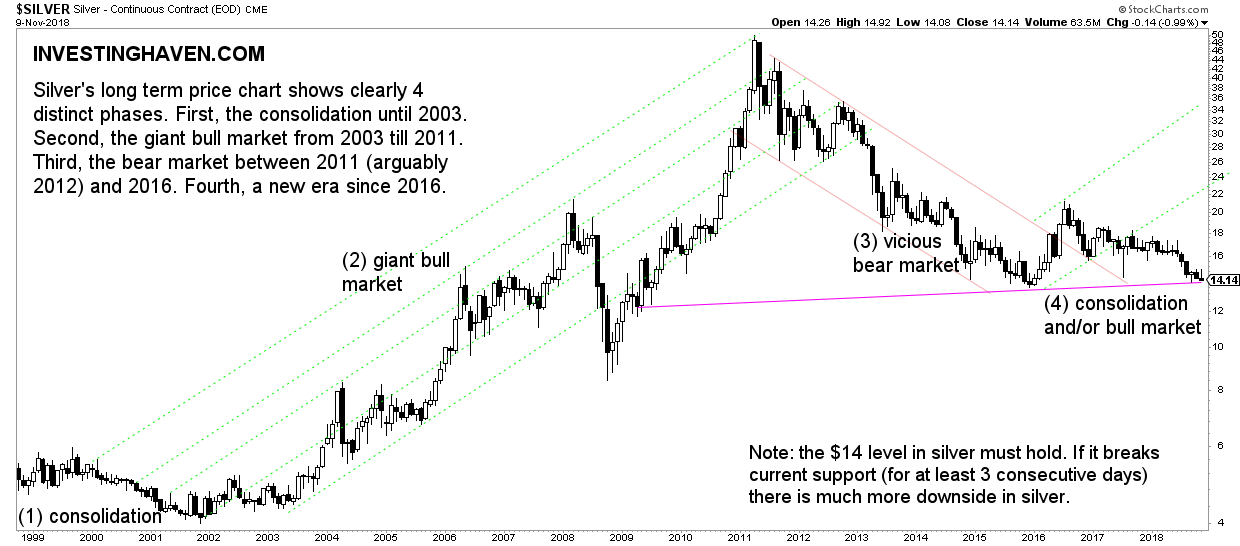
Note that we used the monthly chart in order to say something meaningful about silver in the future. The above silver chart is a monthly chart on 20 years. A too short timeframe will not reveal any meaningful insights as it will not show the dominant trend. A too long chart like this 100 year silver chart is way too long. Choosing the right silver chart timeframe is imperative.
** Update on January 6th, 2019 **
Since we wrote the above article very bullish things happened in the silver market with an impact on the price of silver in the future.
Bloomberg was on record in December identifying a major top in the silver to gold price ratio: “gold was 85 times more expensive than silver per ounce, a ratio not seen since 1995“. Many believe this is an important ratio for silver in the future, but we are very reluctant to give this ratio too much value. A ratio as per our method has only secondary value, and, at best, it may be useful from time to time like at times of extremes.
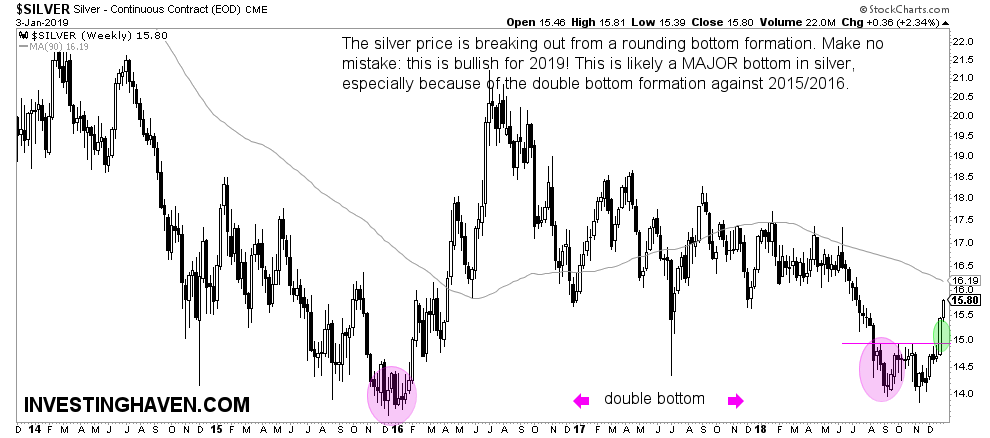
Silver price weekly chart looks bullish for 2019 after a breakout
The most important ‘future in the silver’ data point is the breakout on the daily silver price chart seen here. It certainly is not the jobs report or any other economic data point as those are really meaningless for the future silver price.
Moreover, the up-to-date weekly silver price chart shows that our silver price forecast 2019 is well underway. Not only shows this weekly silver chart the breakout on the daily but it also highlights two more things:
- It shows a giant double bottom, which, as well, is bullish in nature! It also confirms a bullish start of 2019.
- It shows a higher low, especially against the December 2015 low. A higher low is a bullish long term signal.
What we can derive from this weekly silver chart is a price target for 2019. We see a congestion in 2017 and 2018 in the 16.5 to 18.0 area. That’s our first price target.
Our bullish case is the top of the previous decline. It would be in the 20 to 21 area. This is really feasible for silver to get there. We will re-evaluate the new rising channel that silver is trying to set, which is already drawn on above chart with the green dotted lines. The ongoing rally is critical as it will set highs that will be the basis for the future trend pattern on silver’s chart.