Investing Haven
No Result
View All Result
Gold Silver Investing >>
CRYPTO INVESTING >>
  • 2025 Forecasts
    • 10 market predictions
    • Dow Jones forecast
    • S&P 500 forecast 2025
    • Nasdaq prediction 2025
    • Best altcoins to buy
    • Best crypto to buy now
    • Which crypto will explode
    • 15 crypto forecasts 2025
    • Which precious metal to buy
  • Silver
    • Silver prediction 2025 – 2030
    • Will silver exceed $30?
    • When will silver hit $50?
    • Can silver hit $100?
    • Silver shortage
    • 50-year silver chart
    • Silver bullish reversal
    • Silver seasonality charts
    • How to invest in silver
  • Gold
    • Gold prediction 2025 – 2030
    • Will gold set new ATH?
    • Will gold hit $3,000?
    • Can gold hit $10,000?
    • Gold chart 10 years
    • Gold chart 50 years
    • Gold chart 100 years
    • Gold silver ratio
    • Gold seasonality charts
  • Commodities
    • Coffee forecasts
    • Sugar forecasts
    • Nickel forecasts
    • Lithium investing
  • Crypto forecasts
    • BTC prediction 2025 – 2030
    • ETH prediction 2025 – 2030
    • SOL prediction 2025 – 2030
    • XRP prediction 2025 – 2030
    • XLM prediction 2025 – 2030
    • BNB prediction 2025 – 2030
    • ADA prediction 2025 – 2030
    • AVAX prediction 2025 – 2030
    • KAS prediction 2025 – 2030
    • NEAR prediction 2025 – 2030
    • BCH prediction 2025 – 2030
    • LINK prediction 2025 – 2030
    • DOT prediction 2025 – 2030
    • SUI prediction 2025 – 2030
    • ICP prediction 2025 – 2030
    • LTC prediction 2025 – 2026
    • STX prediction 2025 – 2030
    • DOGE prediction 2025 – 2030
    • SHIB prediction 2025 – 2030
    • PEPE prediction 2025 – 2030
    • FLOKI prediction 2025 – 2030
    • WIF prediction 2025 – 2030
    • ONDO prediction 2025 – 2030
  • News
    • Crypto news
    • Commodities
  • Login
Investing Haven
No Result
View All Result

Home » Markets & Stocks » Major Turning Point: End Of 40-Year Bull Market In Bonds

Major Turning Point: End Of 40-Year Bull Market In Bonds

Taki Tsaklanos by Taki Tsaklanos
October 1, 2018
in Markets & Stocks
bond markets
2.2k
VIEWS
Share on FacebookShare on Twitter

Are we about to witness a once-in-a-generation market turning point? The probability is very high that the answer is ‘yes’. The bond market has arrived at such a pivotal point. A small push higher in interest rates, and it would confirm that the 40-year bull market in bonds in the U.S. has ended. That’s correct, a 4-decade bull market in bonds (bear market in yields) is about to make place for a new bear market in bonds. When do we know for sure, and what does this mean to investors?

Note that, technically, it is a 37-bull market right now. But for the sake of simplicity let’s use rounded figures in this article, and continue with ’40-year bull market in bonds’.

Make no mistake, a 40-year bull market in bonds is, by far, the longest active bull market. A turning point in the 40-year bull market in bonds is not only major news, but also comes with major implications.

Let’s lay it out in plain simple terms: if this 40-year bull market in bonds in the U.S. turns into a bear market, with a U.S. bond market size of almost $40 trillion in Q1 of 2017, there will be capital seeking a new home to a level never-seen before.

40-year bull market in bonds: the news

It is a bad habit, admittedly, and every time again we come to the same conclusion: news is the lagging indicator, and smart investors do not really on news because the 1/99 Investing Principles.

As per Forbes the end of the 40-year bull market in bonds will have major implications, unsurprisingly. However, this is really one of the few articles that we like, really. It is the 1% that is worth reading and reflecting on. This is a crucial quote in there:

The failure of getting inflation to rise over the past eight years has thrown a monkey wrench into the central bank strategies of the last 60 years. The game plan was to create long-term inflation, in order to reduce the real governmental debt outstanding, and diminish the real size of that debt mountain. In other words, inflation was the silent tax on individuals. However, nothing is forever. A huge trend change could be starting now. Central bankers will cheer and encourage that trend. A cheaper dollar will be one of the goals.

Pay special attention to the last sentence, in bold (emphasis ours), as that’s for us the key theme: intermarket effects.

In other words, a massive level of capital, never seen before, in the order of $40 trillion, will start moving around. Obviously, not all of it, but a considerable part will move elsewhere. Can anyone imagine what will happen if this becomes a trend into the same direction. Correct: stampede.

Do we know at this point in time in which direction exactly markets will trend? The answer is “no”, and the key point is that new trends will become visible, so it is imperative to monitor markets very closely now, all markets, in order to understand which trend(s) will arise.

As always, there is this opposite side of the story that is there to confuse people. Here is a MarketWatch story that comes with an exotic viewpoint on the bond market, the opposite of the one mentioned above, with this quote summarizing the future of markets:

“In the long term, Gurevich expects the U.S. economy to look more like Japan’s. “We have structural issues like aging demographics, while increasing the budget deficit is deflationary. If that view is correct, then 10-year yields will eventually go into negative territory. From this perspective, the bond rally hasn’t happened yet,” he said.”

40-year bull market in bonds: the most important chart in the world

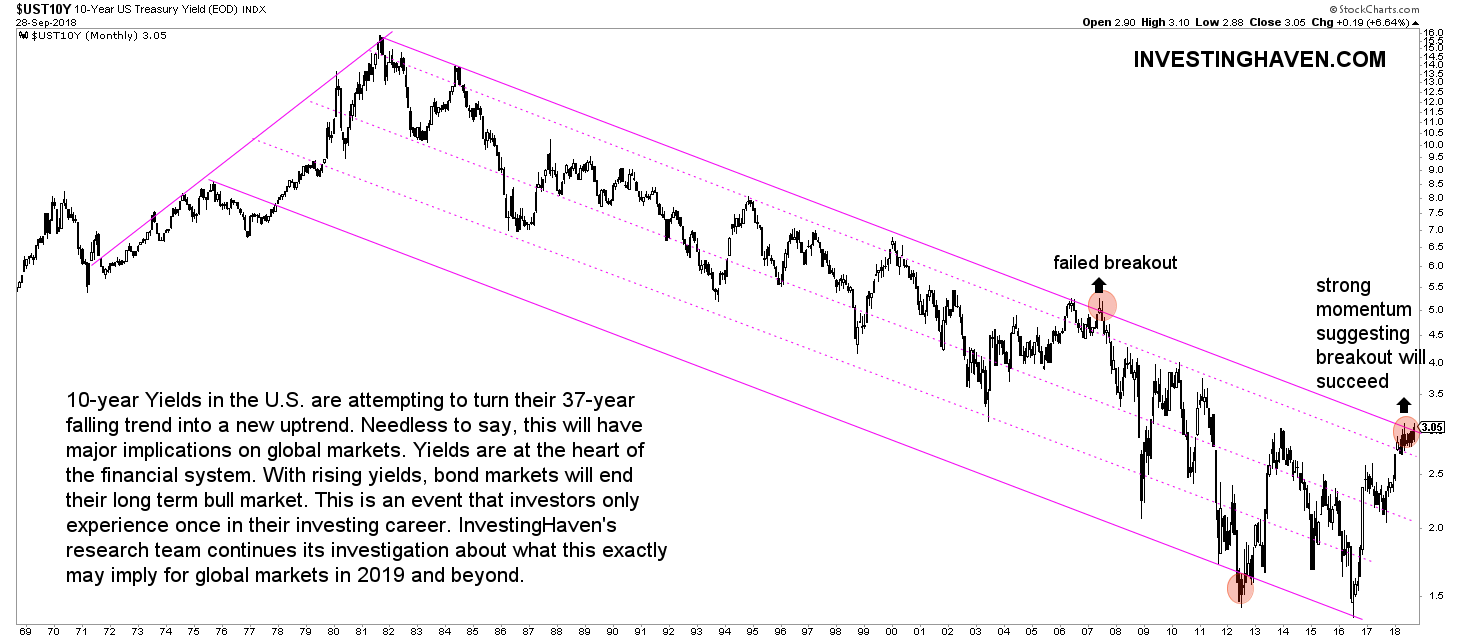
The historic chart of 10-year Yields in the U.S. visualize our point. 

Remember that Yields and bonds are inversely correlated: the lower the Yield, the higher the bond price. So the long term Yield chart provides the insights we need.

As seen on the chart there was an impressive bull market in bonds (bear market in Yields) that started with the peak in 1982. Back then, central planners decided to rise inflation by means of rising rates. It got out of hand.

Be that as it may what is way more important for us, today, is the effect of a turning point, the one that we see happening on the chart. Note that this momentum build-up did never take place before: all tests of resistance were short-lived.

40-year bull market in bonds

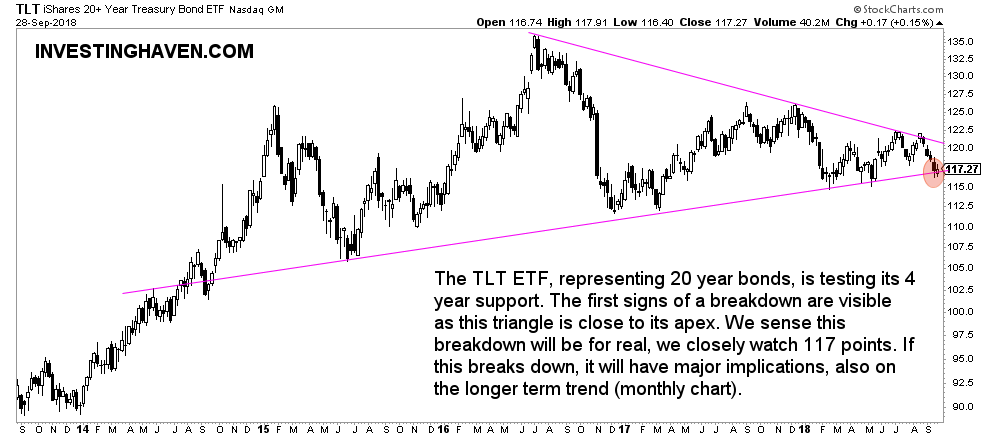
From a different perspective the TLT ETF, representing 20 yr treasury bonds, show the start of a breakdown on the weekly chart.

This is meaningful. The weekly chart represents 5 years, so a pattern that is in play for 4 years, that will get broken to the downside, is significant! We watch the 117 point level closely.

bull market in bonds

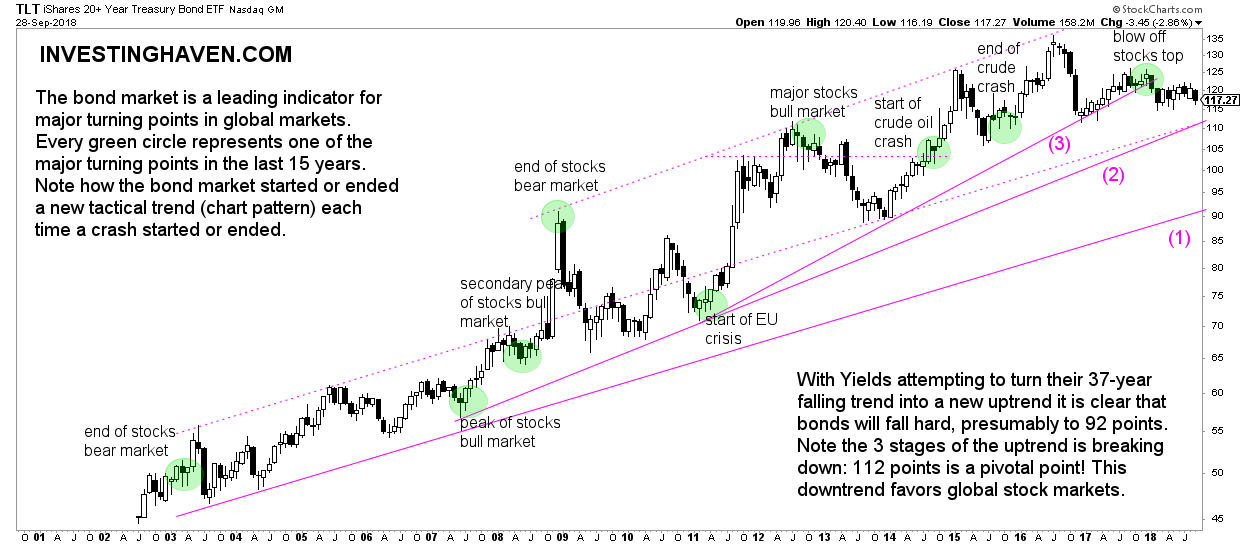
Zooming out the TLT ETF chart we see what a breakdown on the weekly (chart above) may imply in the bigger scheme of things.

The monthly TLT ETF chart has the typical 3 level bull market, a pattern which comes back over and over again. Think of the major gold bull market between 2001 and 2011, which also had 3 levels in its uptrend. Or the Bitcoin uptrend between 2015 and December 2017.

As seen, the fastest rising trendline got broken in January of this year. There is some 7% downside until trendline (2). Ultimate support will sit at 92 points.

Time will tell whether the bond market will totally crash, too hard to forecast this right now.

One thing is for sure: the exodus out of the largest asset in the world will create ripple effects, and there will be great opportunities.

Our advice is to closely watch what the U.S. dollar will do on its chart. Any weakness will be amazingly bullish for commodities and stocks. The opposite is true as well. This is a time in which chart analysis will pay off big time as charts will reveal all new trends.

bull market in bonds

10-YEAR ANNIVERSARY OFFER: InvestingHaven.com celebrates 10 years. Temporarily, you can enjoy a discount on our premium gold/silver and crypto reports. Or you can become a VIP member. Go to our anniversary deals >>
Receive our weekly newsletter.

premium service SP-500 premium service trade alerts premium service crypto teaser 

No related posts.

Tags: TLT
Taki Tsaklanos

Taki Tsaklanos

Taki has +15 years of experience in global markets. He is passionate about forecasting markets - he calls it THE ART OF FORECASTING. His analysis methodology is unique and effective, yet easy to understand; it is based on chart analysis combined with intermarket / fundamental / sentiment analysis. His work appeared on major financial outlets like FinancialSense, MarketWatch,Twitter: twitter.com/investinghaven

Connect with InvestingHaven

Receive top notch forecasts for free.

*We hate spam as you do.

Site Navigation

  • RSS Feed
  • About us
  • Advertising
  • Sponsored Content Policy
  • Mission 2026
  • Sitemap
  • Privacy & Disclaimer
  • Terms of Service
  • Contact Us
investing haven logo

Precious metals market analysis including gold and silver price predictions. Crypto market analysis including highly accurate BTC ETH SOL XRP forecasts.

Copyright © 2025 InvestingHaven

Login to your account below

Forgotten Password?

Fill the forms bellow to register

All fields are required. Log In

Retrieve your password

Please enter your username or email address to reset your password.

Log In

Receive top notch forecasts for free.

*We hate spam as you do.

No Result
View All Result
  • News
  • 2025 Forecasts
    • 10 market predictions
    • Dow Jones forecast 2025
    • S&P 500 forecast 2025
    • Nasdaq prediction 2025
    • Best crypto to buy now
    • Which crypto will explode
    • Best altcoins to buy
    • 15 crypto forecasts 2025
    • Which precious metal to buy
  • Silver articles
    • Silver prediction 2025 – 2030
    • Will silver exceed $30?
    • When will silver hit $50?
    • Can silver hit $100?
    • Silver shortage
    • 50-year silver chart
    • Silver bullish reversal
    • Silver seasonality charts
    • How to invest in silver
  • Gold
    • Gold prediction 2025 – 2030
    • Will gold set new ATH?
    • Will gold hit $3,000?
    • Can gold hit $10,000?
    • Gold chart 10 years
    • Gold chart 50 years
    • Gold chart 100 years
    • Gold silver ratio
    • Gold seasonality charts
  • Commodities
    • Sugar forecasts
    • Coffee forecasts
    • Nickel forecasts
    • Lithium investing
  • Crypto news
  • Crypto forecasts
    • BTC prediction 2025 – 2030
    • ETH prediction 2025 – 2030
    • SOL prediction 2025 – 2030
    • XRP prediction 2025 – 2030
    • XLM prediction 2025 – 2030
    • BNB prediction 2025 – 2030
    • ADA prediction 2025 – 2030
    • AVAX prediction 2025 – 2030
    • KAS prediction 2025 – 2030
    • NEAR prediction 2025 – 2030
    • BCH prediction 2025 – 2030
    • LINK prediction 2025 – 2030
    • DOT prediction 2025 – 2030
    • SUI prediction 2025 – 2030
    • ICP prediction 2025 – 2030
    • LTC prediction 2025 – 2026
    • STX prediction 2025 – 2030
    • DOGE prediction 2025 – 2030
    • SHIB prediction 2025 – 2030
    • PEPE prediction 2025 – 2030
    • FLOKI prediction 2025 – 2030
    • WIF prediction 2025 – 2030
    • ONDO prediction 2025 – 2030
  • Premium Crypto Alerts
  • Premium services

Copyright © 2025 InvestingHaven