Gold had a rough week. The short answer to the question why gold is not shining is because the USD is shining. The long answer goes beyond the scope of this short blog post but is certainly easy to explain with inter market analysis and leading indicators.
Theoretically, there are plenty of reasons for gold to shine. It is both a fear asset and inflationary asset. In a world governed by fear currently (war, weather, uncertainty in markets, to name a few) but also inflation it would make so much sense for gold to trade around 2500 USD.
However, at the same time, we do know that the monetary policies around the world are all about tightening to get ‘out of hand’ inflation under control.
The million dollar question is which of these conflicting trends is winning?
The answer: none.
In our latest gold article 5 Must See Gold Price Charts As The Second Half Of 2022 Kicks Off we stated that the invalidation level for the bullish thesis in Gold remains $1700.
While the decline in gold over the last week was tough to stomach continued trading above our invalidation price which is $1700.
Moreover, in our article Gold Price Outlook Following FOMC Rate Hike In June we mentioned the importance of intermarket effects like bond yields and the EUR. Bond yields seem to have topped, the EUR might have bottomed as per the weekly EURUSD chart featured in Leading Indicator For Global Markets Setting A Secular Bottom.
The daily gold price chart, in the meantime, shows that gold stopped falling right above the previous lows set in March / April / August / September of last year. This is important because it happened in the week when the Euro touched 7 year support (article link above).
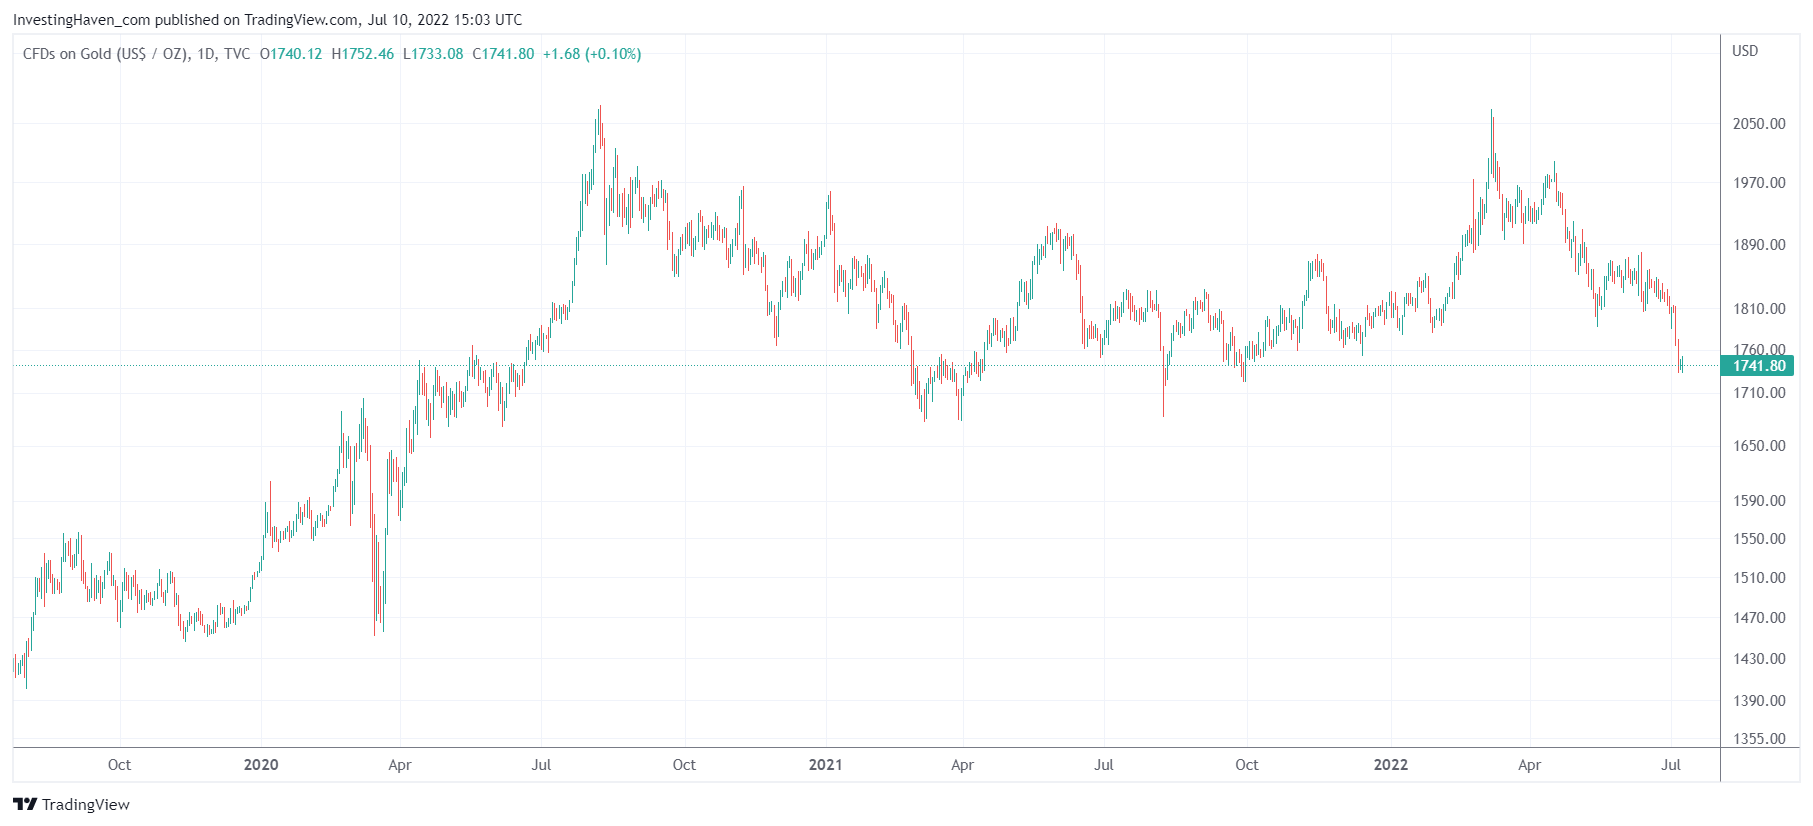
So, if we try to read the chart to answer the question “which trend is winning” we believe the chart is saying “none.” Presumably, the more accurate answer is “none yet” but we need a few more weeks to understand if the USD is indeed topping / the EUR bottoming and how the Fed will react to next week’s CPI data.
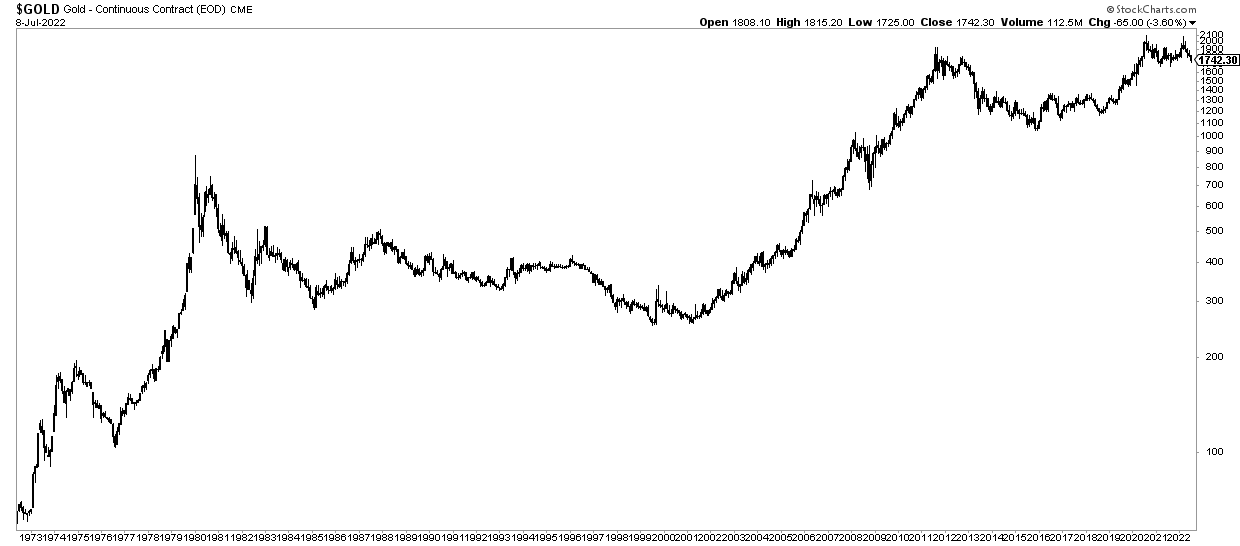
Even if we take the longest possible view, the quarterly chart on 50 years, we observe a continued test of previous highs. What we also observe is the importance of the $1700 level.
We can easily see a giant cup-and-handle pattern on this longest term chart (very bullish) or a topping pattern in the last 24 months (bearish). None of the two are confirmed. Gold is trendless and waiting direction from other markets, first and foremost the USD and the EUR.
Note that we continue to believe that silver is a juicy long term investment.
The gold to silver ratio is now at a point where it has always found resistance, very often huge resistance, right before a really big move in the price of silver started.
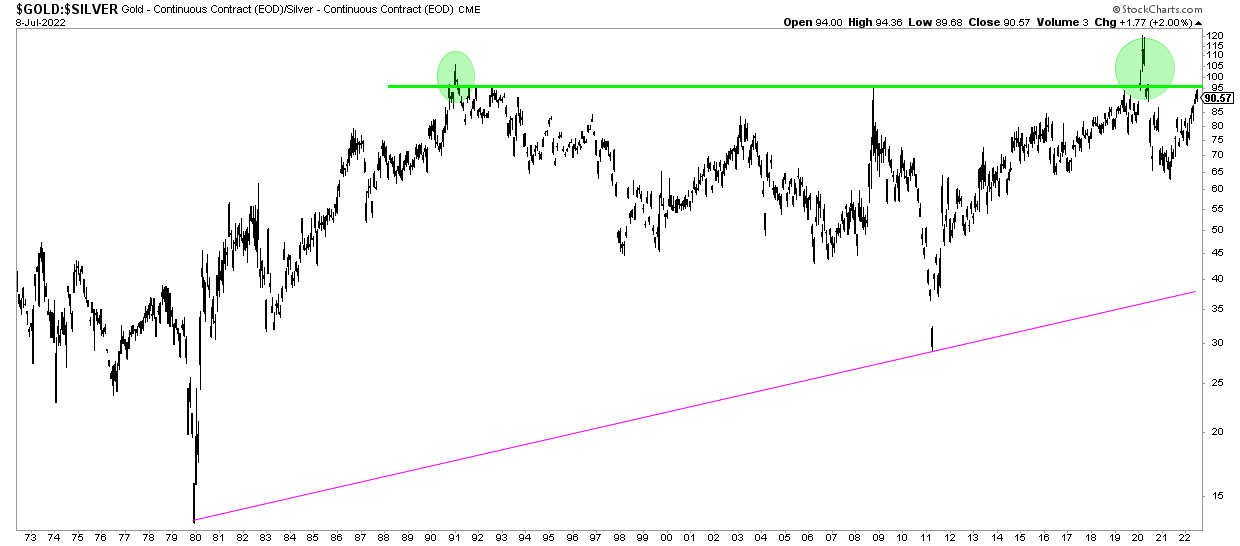
Will this time be different?
In two of our premium services we track the silver market closely. In our Momentum Investing service we look at silver as an investment and have a top 5 silver mining selection which we update from time to time. In our Trade Alerts service we look at the price of silver (also leading indicators) in order to understand when it’s ready for a short term swing.


