Litecoin is on the move, and we saw this coming when we sent a crypto alert to premium crypto investing research members on February 11th, 2021, early in the morning: Is LTC Next To Move … Higher. Since then LTC is up 16%. Now in relative terms in the crypto space that’s not impressive at all. However, we flashed this buy alert right the day before LTC set what we call a ‘momentum candle’, a term that is used only by InvestingHaven. Buying any market, stock, asset, crypto coin before a ‘momentum candle’ is a recipe for success. That’s how we pick coins and stocks in our premium services. In other words we do our forecasts, of which our crypto predictions for 2021, and carefully monitor to enter when a market rigth before it is ready to start momentum.
In this article we feature a few quotes from our note sent on Thurday, Feb 11th.
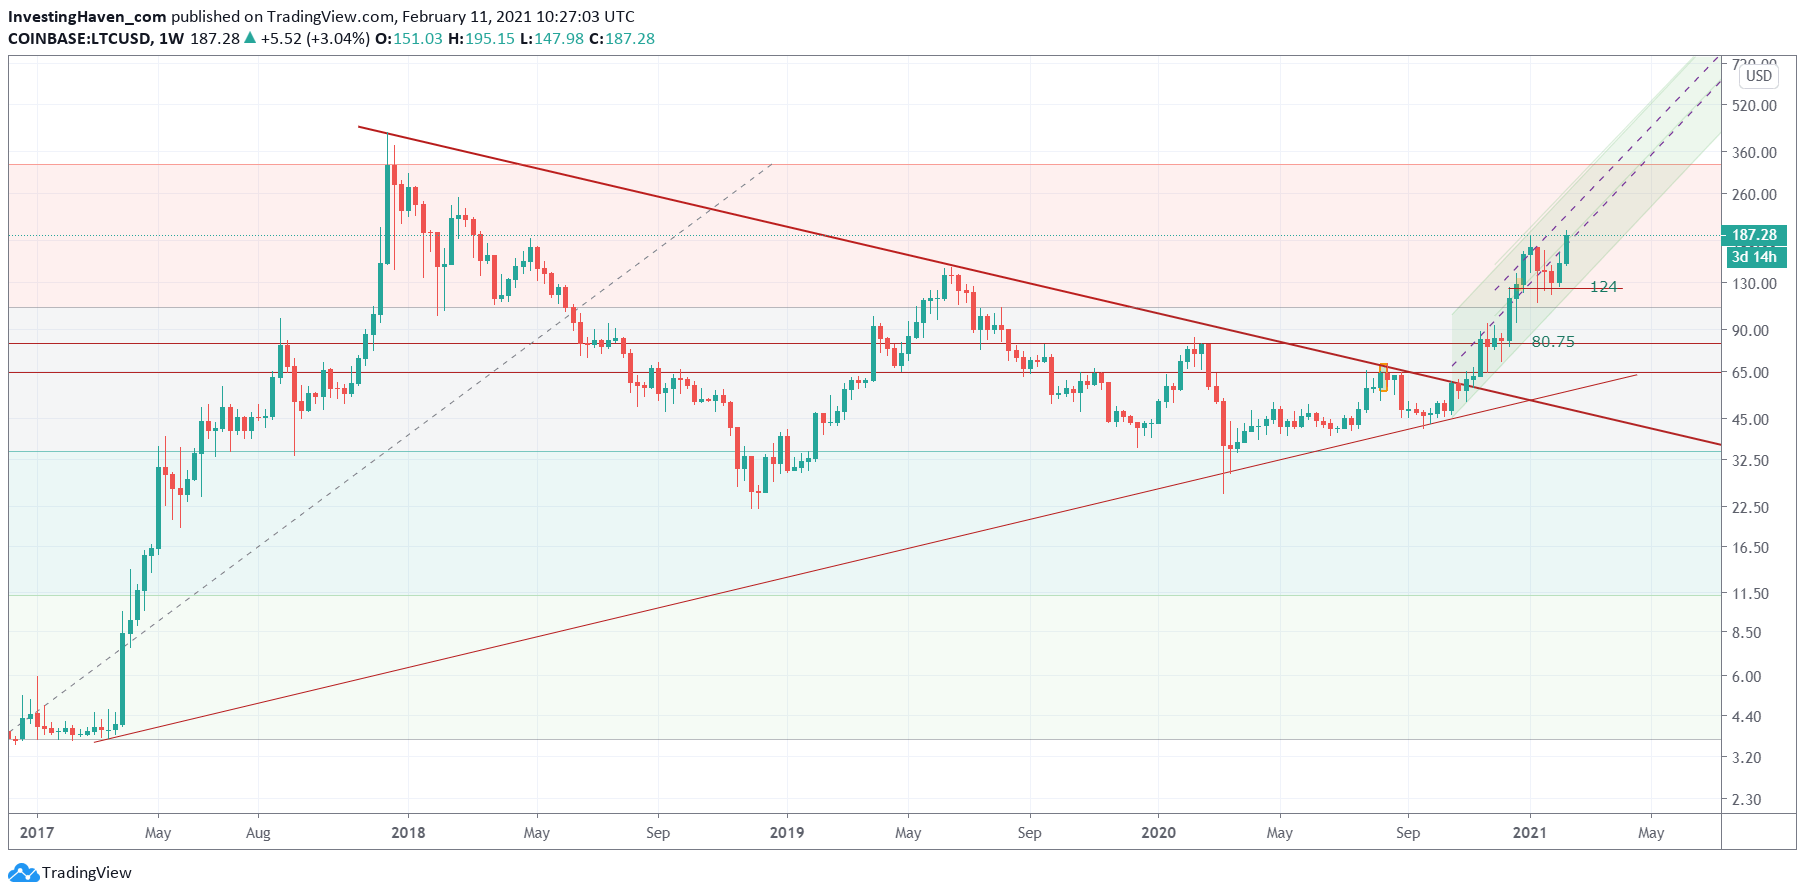
LTC is right trying to break above 188 USD It must respect 177 USD, daily open and closing basis, say for the rest of this week.
IF it continues its breakout, which is ongoing NOW, it will move to 250 USD and next 325 USD.
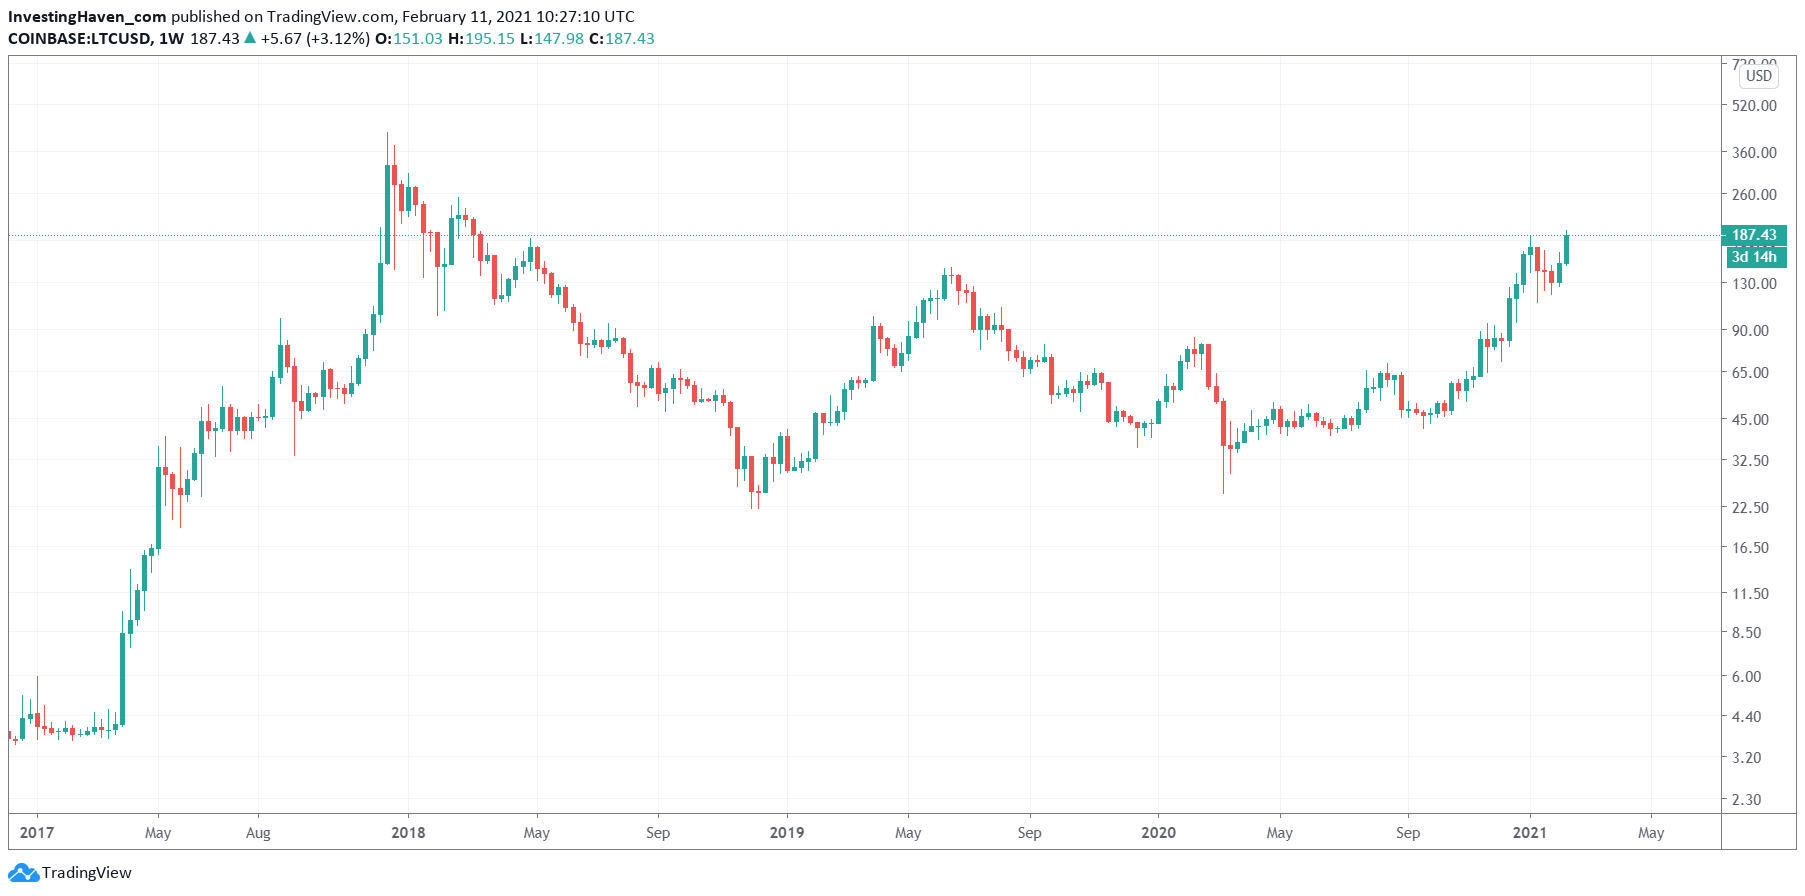
 The same weekly chart without annotations:
What we see on this chart is what we could call the ‘Ethereum moment’. When Ethereum broke above 800 USD it accelerated its uptrend. It started rising faster, and crushed the rising trendline / trend channel.
So in case you missed ETH, you have an opportunity now to play LTC which is presumably starting its acceleration phase NOW. That’s a way to make up for the ‘ETH emotion’: instead of being sad, try to be smart, and stay positive.
Now why are the above 2 charts so important to feature in this public blog post?
It’s because we featured LTC right before it set a ‘momentum candle’. This is a term that we use over at InvestingHaven in a way nobody else is using it. It stands for the largest candle in many months, sometimes even years.
Why is this important? Because when you get in before a ‘momentum candle’ you are ‘protected by the chart’. This really means that the market is likely not going to fall below the lowest point of that ‘momentum candle’.
If we check the weekly LTC chart as it stands today, with 4 more days of data compared to the 2 charts above, we clearly see that this week’s weekly candle is the largest one since the first week of April of 2019.
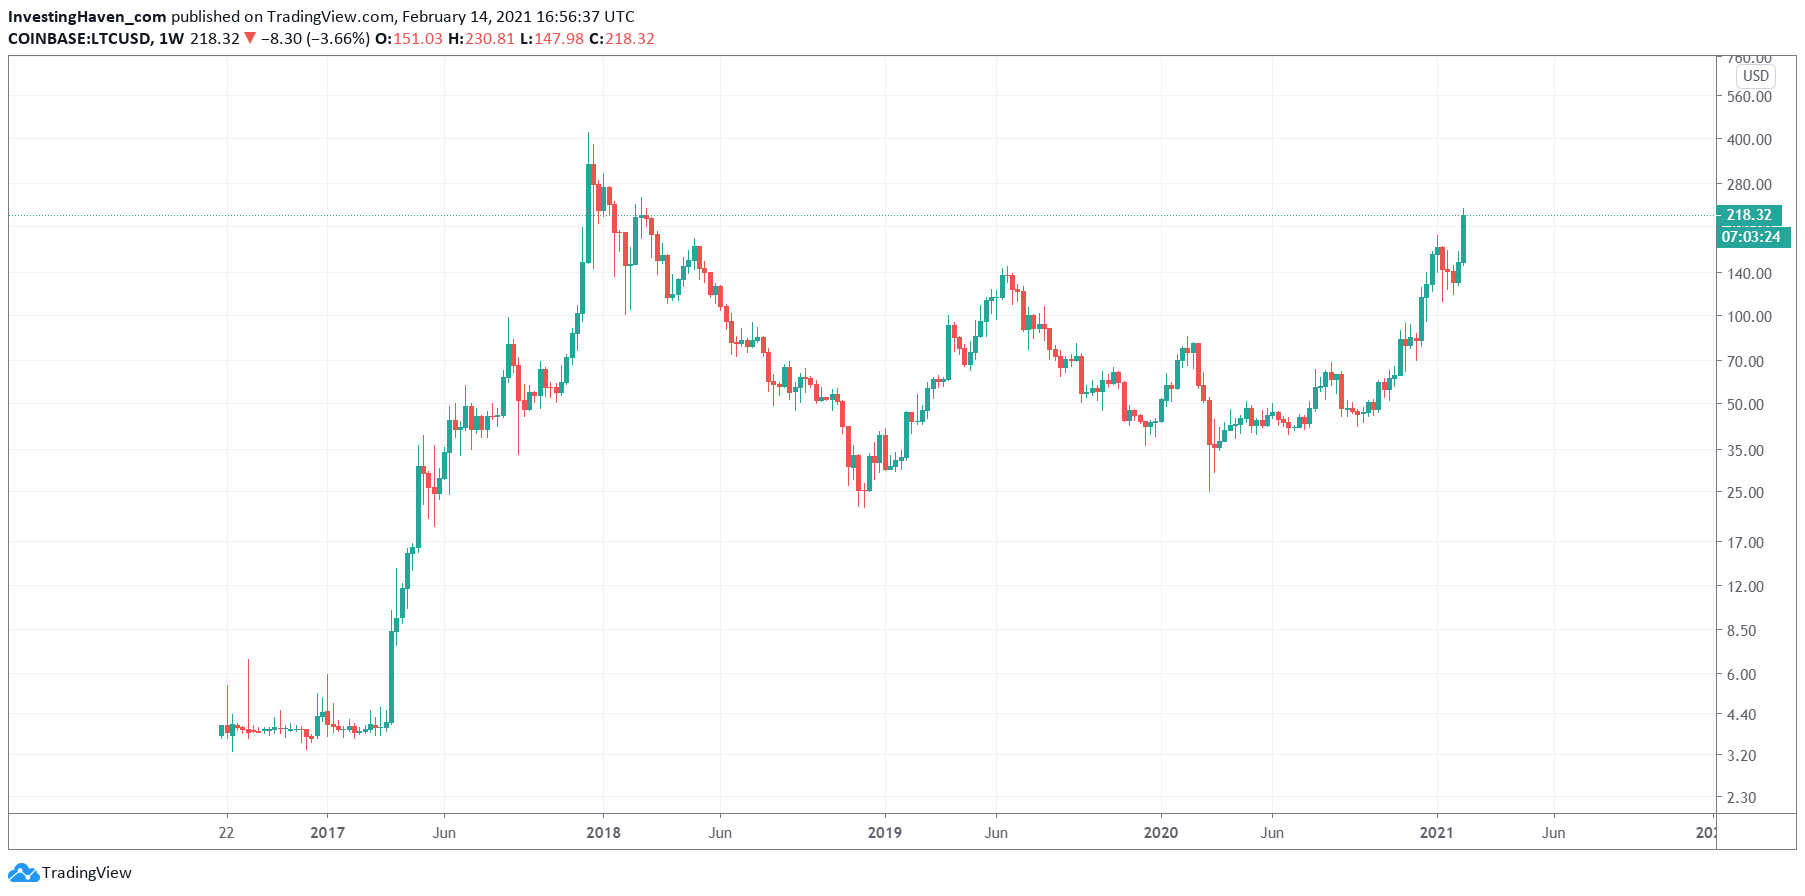
This really means that the probability of LTC falling back below say 180 USD in this current momentum cycle is extremely low. In other words those who bought on Thursday, right above 180 USD, should not worry about their downside protection as that’s what the chart is doing for them. They can focus on maximizing their profits by picking the right exit level.
That’s what ‘protected by the chart’ means, and that’s what we constantly do over here at InvestingHaven in all our premium services. This article proves how our premium crypto research service members have an edge, they get the right info at the right time. In the public domain we tend to post premium research insights with some delay, just to illustrate the solidity of our work.