
Our latest gold price forecast: gold will come close to to $2,200 in 2024 because of the bullish setup of its leading indicators. We predict that gold will move to $2,200 and pull back from there in 2024, it might slightly exceed $2,200. After a pullback, we see gold moving to $2,500 in 2025.
Nowadays, anyone can create and share a gold price forecast, particularly on social media. The quality of forecasting, the forecasting methodology, the analysis framework don’t matter any longer. It’s about the clicks and likes.
Moreover, what we often find by searching for gold forecasts in search engines, are AI generated tables, with gold price calculations for the next years. These tables are so-called gold price predictions. Over here, at InvestingHaven.com, we are not using AI, nor are we here to create a presence on social media.
Gold forecast analysis – outline
We think of a gold price forecast as an art and a skill. If you are looking to understand the true dynamics driving the gold price, you will like our gold price prediction methodology.
- 1. Three leading indicators for our gold price predictions
- 2. Our gold price prediction for 2024
- 3. Gold predictions vs. gold news
- 4. Gold charts that support our 2024 forecast
- 5. Gold’s leading indicator #1: Euro (USD)
- 6. Gold’s leading indicator #2: Bond yields
- 7. Gold’s leading indicator #3: Inflation
- 8. Gold price forecast 2024: conclusion
- 9. Gold or silver in 2024? Our answer: silver!
- 10. Predicting the price of gold: our track record
We published a few must-read articles on gold, recently:
- First, we made the point that gold is expected to move higher and set new ATH. We used very different data points in that article, compared to the data points in this current gold price forecast.
- Second, we asked ourselves the question: ‘will gold print new all-time highs in 2024?‘ The short answer: “Yes, we are convinced that gold is on its way to print new all-time highs, in the first quarter of 2024 presumably.”
- Third, big picture, we looked at historical gold price trends and what it means for investors: : 100-year gold price trend.
The above mentioned articles combine short term viewpoints, forward looking thoughts with secular analysis.
1. Gold price leading indicators
We apply a limited number of leading indicators for our gold price predictions:
- The Euro (inversely correlated to the USD).
- Bond yields.
- Inflation indicators.
All three combined help us forecast the future path of the price of gold. Moreover, it is by using these 3 indicators that we were able to accurately forecast annual gold price targets some 9 months prior to the market hitting them.
2. Our gold price prediction 2024
Based on the long term charts which show gold’s dominant patterns we expect gold to consolidate in a wide range between 1,750 and 2,200 USD/oz. We expect a long term bullish reversal to push the gold price to new ATH with $2,200 as a first bullish target (give or take 5%), followed by $2,500 in 2025 and ultimately $3,000 to be hit in the period 2025-2026.
InvestingHaven’s research team strongly believes that gold’s dominant trend is long term bullish. However, with the end of restrictive monetary policies we see gold moving higher in the first half of 2024.
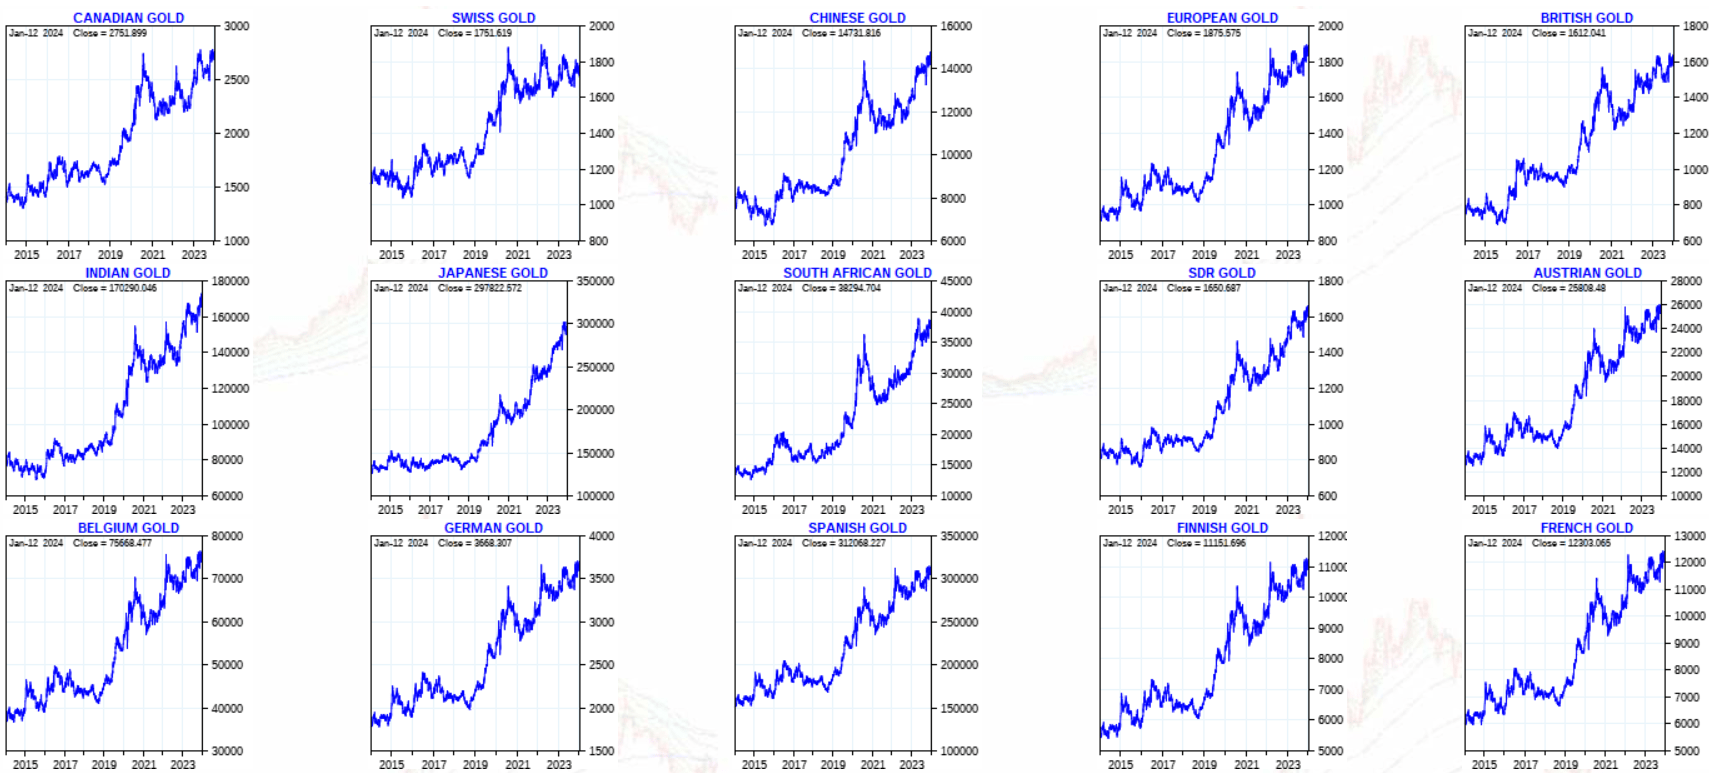
Note that most gold price predictions are U.S. centric (gold priced in USD). What many investors don’t realize is that gold is setting new all-time highs in each and every other currency as evidenced by this magnificent chart (by Goldchartsrus).
We see sufficient signs that the Fed will reverse its tightening policy in 2024. This does not imply they will lower the Fed Funds Rate immediately. It implies they will stop pushing and talking rates up. As the market is a forward looking mechanism, the market is already starting to factor in the fact that rates will eventually come in, as suggested by the 2-Year Treasury Yield divergence with the Fed Funds Rate.
3. Gold predictions vs. gold news
One common mistake is to look for clues about gold’s future price trend in the news.
It is tempting to read articles, but the point is that financial media’s economic model is primarily based on advertising revenue. In other words, headlines need to collect clicks in order for financial media to remain in existence. This does not mean that each and every gold article is bad or irrelevant, it implies that the essence of gold forecasting for gold investors is not to be found in financial media.
The point is this: gold news is lagging, often irrelevant.
Illustration: Gold prices tepid as focus turns to US Fed in data-packed week
Gold speculators raise net long position. At least 7 U.S. Fed officials due to speak this week. Focus on Tuesday’s U.S. consumer price index report.
The tiny change in gold speculators long positions was absolutely meaningless. The big drop since they were collectively long was the really important and relevant data point. The timeframe is very narrow, it’s not helpful.
Illustration: Price of gold and silver expected to rise with interest rate cuts, UBS analyst projects
Analysts forecast that the price of gold and silver will rise if the Federal Reserve cuts interest rates this year, according to a report from CNBC Sunday. Joni Teves, precious metals strategist with investment banking company UBS, told CNBC that she expects gold prices to hit $2,200 per ounce by the end of the year. “We are expecting gold to be pushed higher by a Fed easing. Also this comes with a weaker dollar,” Teves said.
Isn’t it so obvious that monetary easing by the Fed is going to push the price of gold higher?
4. Gold charts that support our 2024 forecast
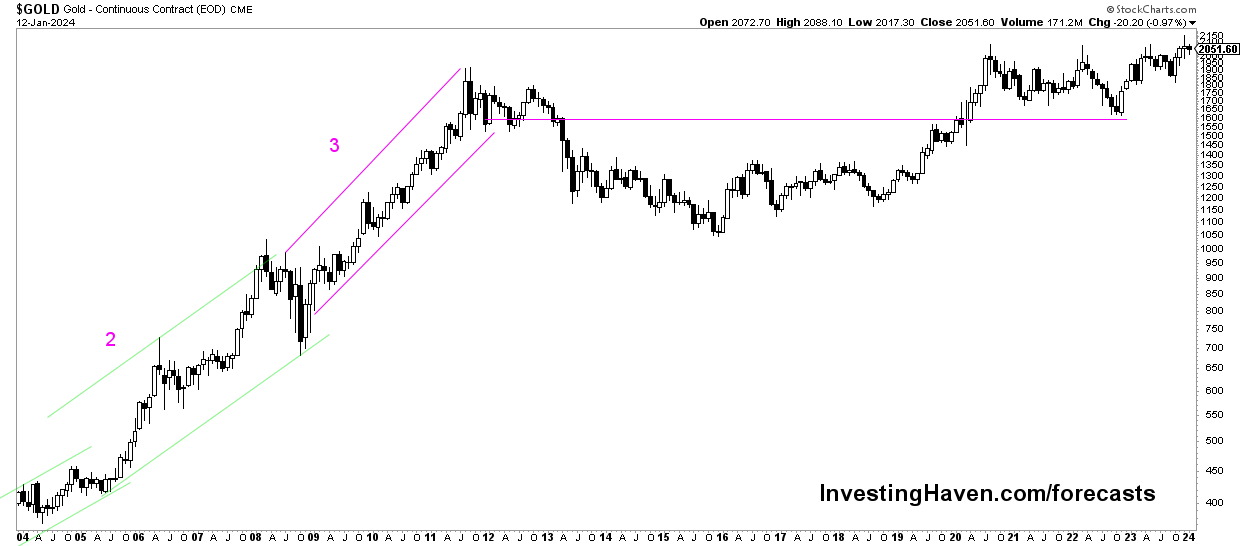
The power of the pattern.
The long term gold price chart shows a long term bullish reversal between 2013 – 2019.
The price of gold created either a topping pattern in 2020/2022 or is in the process of creating a cup and handle. We cannot rely solely on the gold price chart to make the call which of the 2 scenarios are most likely. We need leading indicators to help us understand which path gold might take.
The same findings that we get from the quarterly chart shown above are visible on the long timeframes of gold’s historic interactive chart.
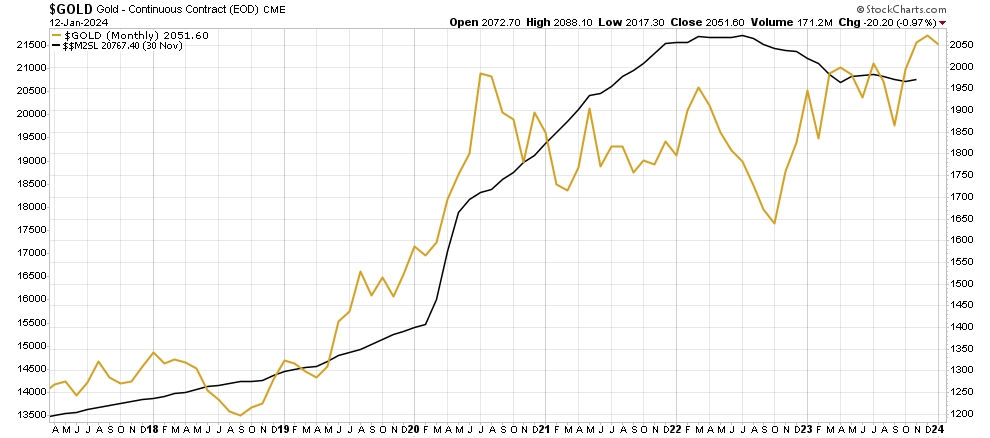
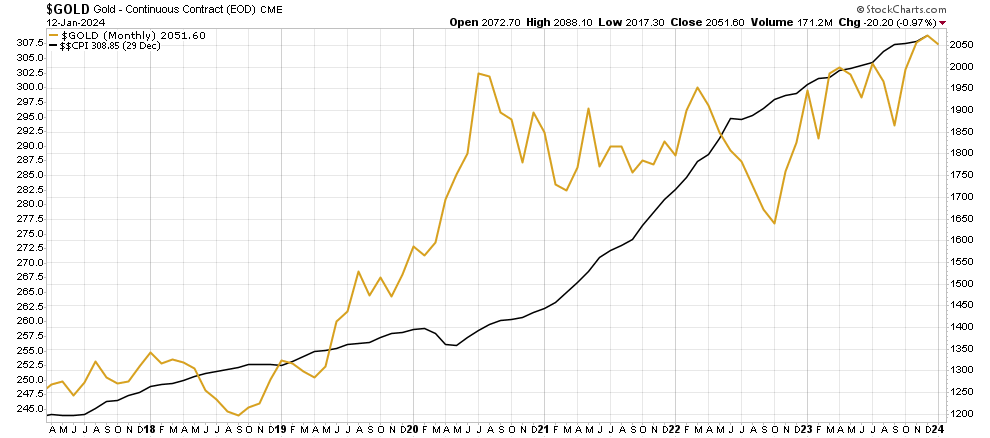
Very important: the correlation between the price of gold and the monetary base M2.
As seen on below chart, the monetary base M2 continued its steep rise in 2021. It started stagnating in 2022. Historically, we see that gold and the monetary base move in the same direction. Gold tend to overshoot the monetary base but mostly it tends to happen temporarily. Both are more in synch now. This suggests that gold in nicely in synch with the monetary base: markets that directly influence the gold price, think USD and Yields, will play a crucial role in determining the future gold price trend.
Several more data points will help us understand whether gold will consolidate with $2,200 as an upside projection for 2024. They are presented in the next sections.
5. Gold’s leading indicator #1: Euro (USD)
Gold tends to go up when the Euro is in a bullish mindset. Consequently, when the USD is rising it puts pressure on gold.
We need to understand the secular patterns in order to get an understanding of gold’s projected path.
The longest term Euro chart has 2 targets: 0.9666 and 0.91 approx.
As seen, 0.9666 was achieved in September of 2022. This level coincides with the lows printed in 1989, a very important price point simply because it goes back so many years in time.
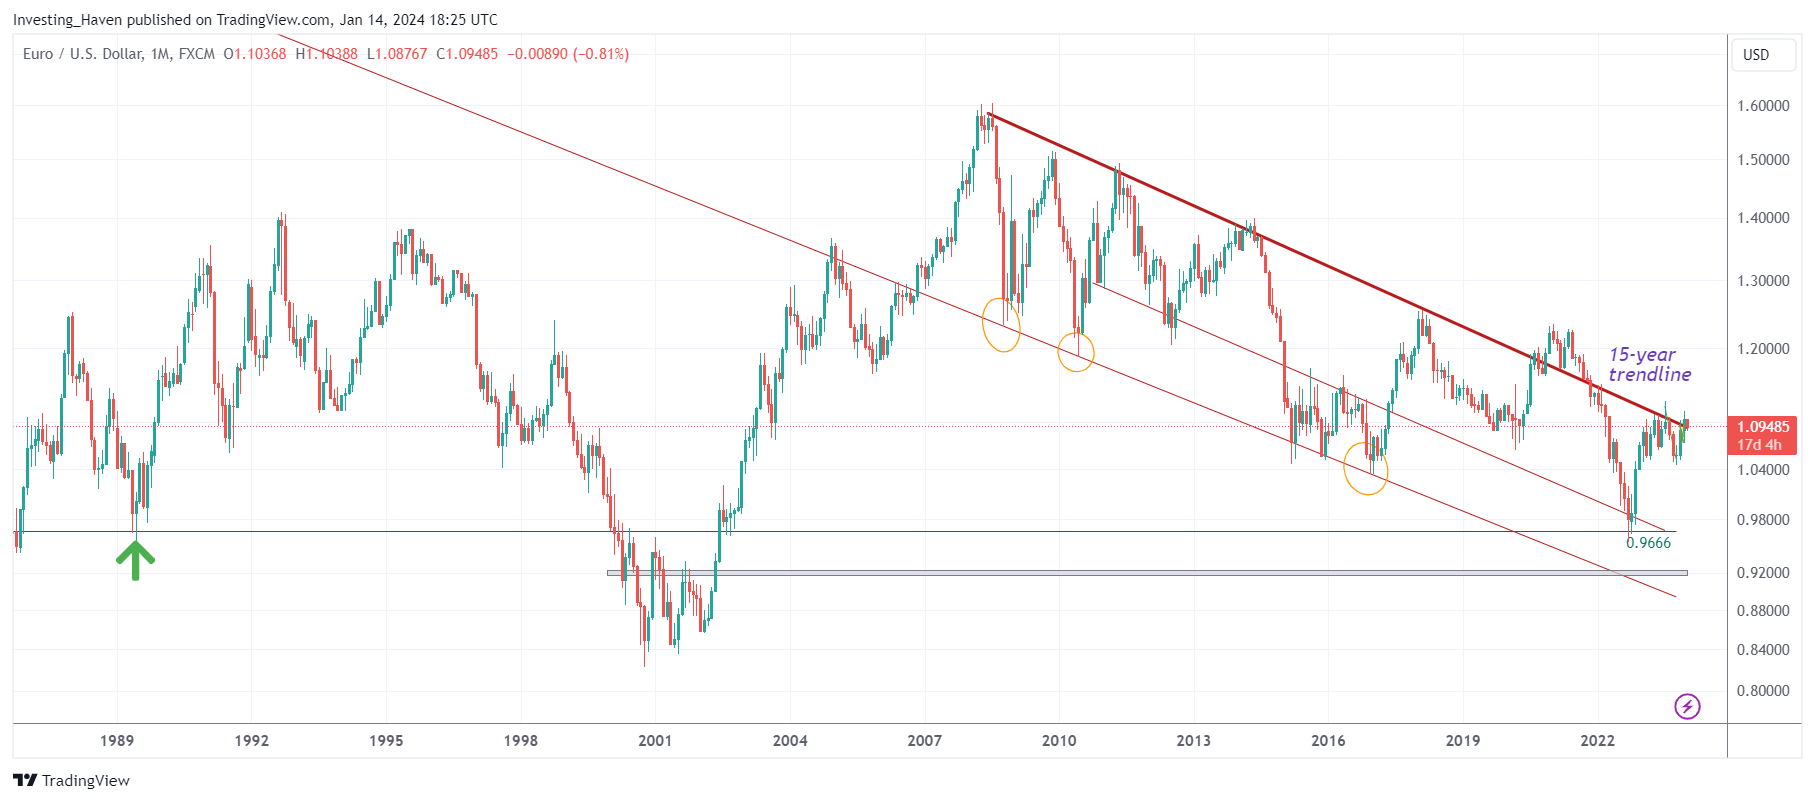
We don’t see the Euro falling below the 2001/2002 lows. This should prevent gold from starting a long term bear market.
The Euro’s longest term chart suggests that the Euro against the USD is hitting resistance around 1.10 points. At the same time, we notice that volatility is declining which is good news for gold. The one scenario in which gold cannot shine is when the USD is too strong, rising too fast.
6. Gold’s leading indicator #2: Bond yields
Bond yields are inversely correlated to gold. They are not as strong a leading indicator as the Euro. Gold can rise when bond yields are flat or range bound.
Treasuries are negatively correlated to bond yields. Treasuries are positively correlated to the price of gold and it should be combined with the Euro trend to get the full picture. The long term 20 yr Treasuries chart (TLT) helps us understand how future trends might impact gold.
The long term TLT chart went from 180 points to 100 points in 24 months. This is historic, never happened before. We don’t expect Treasuries to continue their decline, we expect them to stabilize around current levels. Stated differently, there is more upside potential than downside potential in Treasuries.
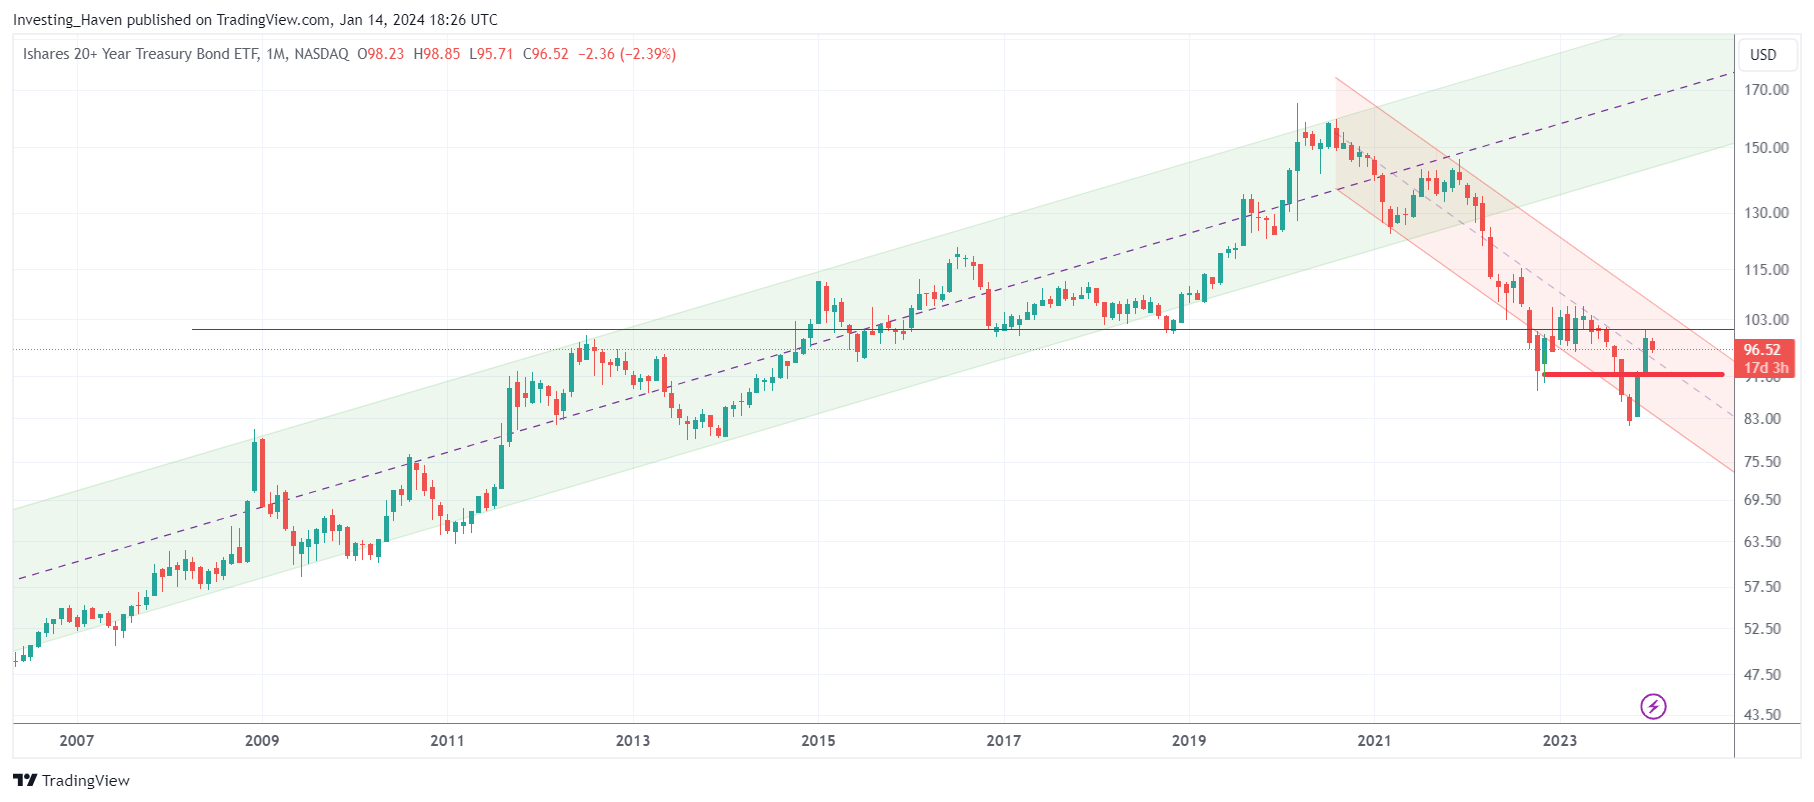
So, in terms of impact of currencies on gold, we believe there is more upside potential than downside potential in the Euro (positively correlated to gold), although over the long term which means at least 12 months out.
Also, in terms of impact of Treasuries on gold, we believe there is more upside potential than downside potential in TLT.
Both should prevent gold from falling in a long bear market and should support our thesis of gold being range bound in 2024 before continuing its uptrend.
7. Gold’s leading indicator #3: Inflation
Gold shines in an inflationary environment.
Inflation expectations expressed by TIP ETF came down in a dramatic fashion. We don’t expect this trend to continue in 2024 especially since monetary policies are close to being stretched in terms of rate hikes.
Moreover, TIP came down to a long term trendline (support) which connects the lows of the epic 2008/9 and 2020 market crashes.
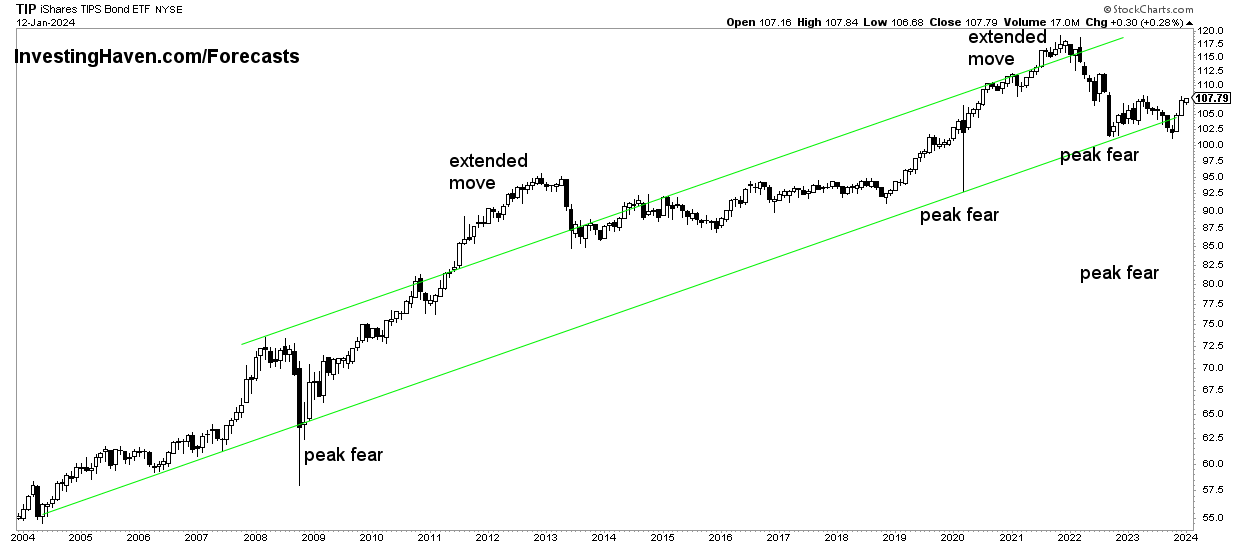
We expect gold to be supported in 2024 by TIP which is now clearly stabilizing so it can start rising again over time. A rise in TIP (inflation expectations) is good for gold, as both assets are positively correlated.
Monetary inflation is easing but eventually it will move up again. The divergence between gold and the monetary base will moderate eventually.
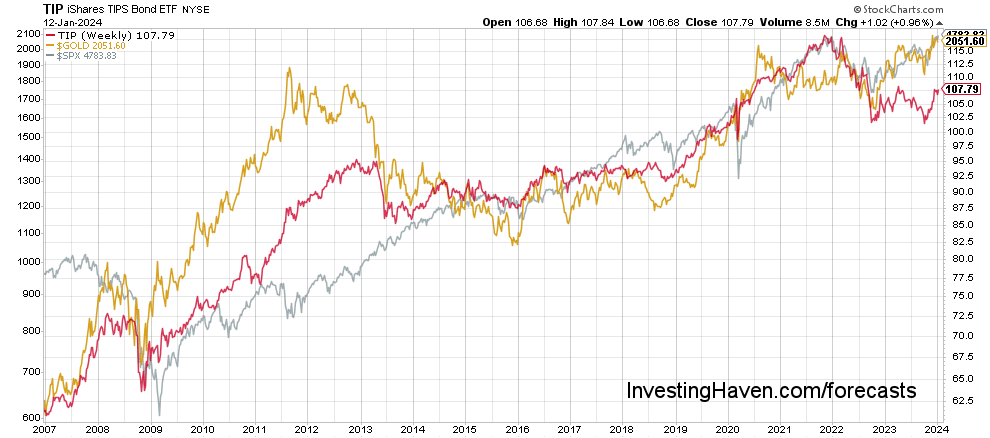
When we look at the historic relationship between TIP, gold and stocks, we can see how a decline in TIP has led to lower gold and stock prices. However, as TIP is hitting long term support, it should suggest that gold and stocks will move higher in 2024, although it might happen at different points in time.
8. Gold price forecast 2024: conclusion
It is clear that we have sufficient confirmation from the gold chart patterns on all timeframes as well as gold’s leading indicators that gold may stabilize and remain range bound in 2024.
The U.S. Dollar does have less upside potential than downside potential in 2024. The same accounts for Treasuries. Inflation expectations should resume their uptrend at a certain point in 2024.
Our gold price forecast of $2,200 at the higher side.
Our #gold price forecast for 2024 is mildly bullish with a target of $2,200. We expect $GOLD to peak somewhere in the 1st half of 2024 provided it clears $2,000 in the first quarter of 2024. Click To Tweet
9. Gold or silver in 2024? Our answer: silver!
Should investors focus on gold or silver in 2024? Our answer is very clear: silver! We explained this in great detail in Which Precious Metal To Buy For 2024: Gold vs. Silver?
That’s because of the much stronger fundamentals of silver compared to the ones of gold.
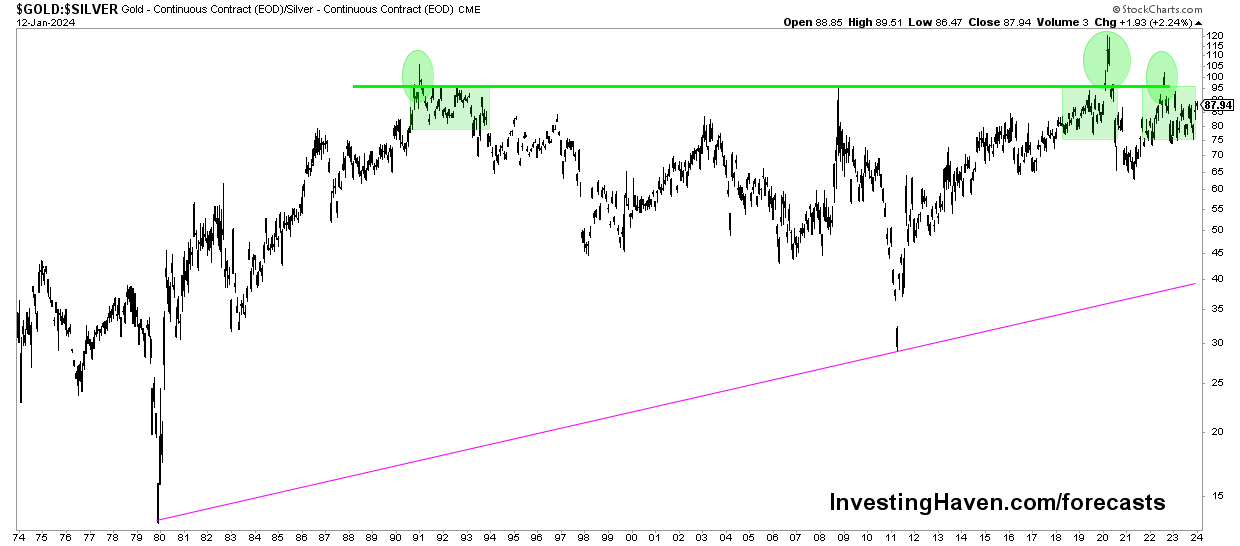
Also, one of our precious metals indicators, the gold to silver ratio, suggests that the downside in silver is limited and the upside huge. As explained in One Silver Chart Justifies ‘Buy The Dip’ For Long Term Positions:
In essence, any readings above or near 100 (gold price : silver price) are long term buy opportunities. It happened 2 times in history, a few weeks ago was the 3d time. We are confident that silver is a long term buy. Yes, buy the dip is justified (provided no leverage) regardless what happens to precious metals in the next few weeks and months.
The historic gold to silver ratio chart is featured below.
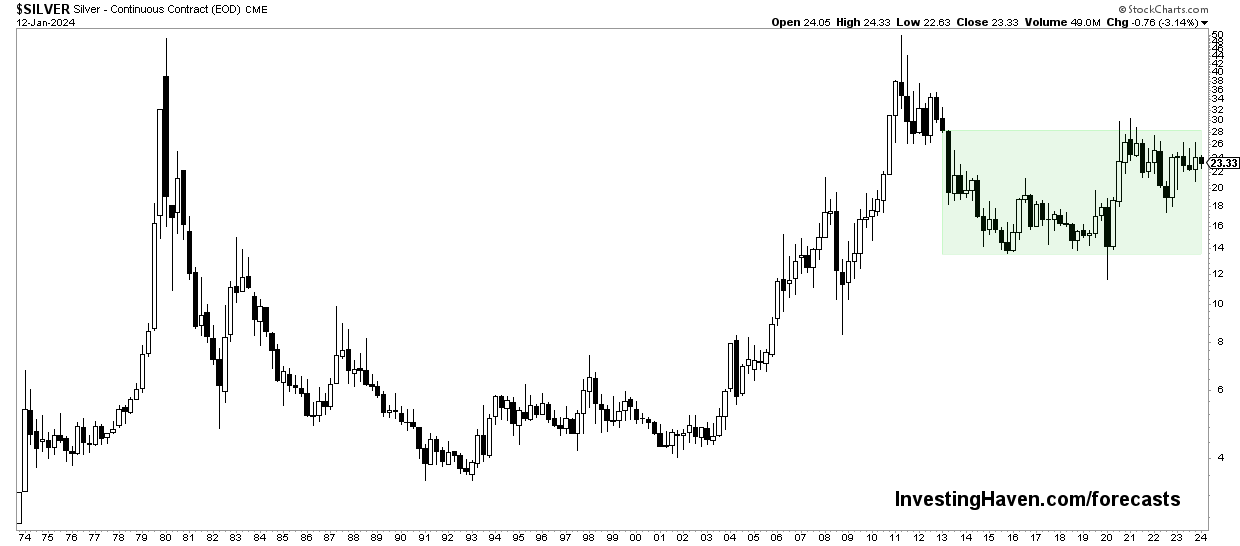
The silver price chart over 50 years says it all: a wildly bullish cup and handle formation that may get aggressive in 2024 in favor of silver.
10. Predicting the price of gold: our track record
For 5 years in a row our gold forecasts were phenomenally accurate. They are all still available in the public domain on our blog, and the table below depicts the summary of each year’s gold forecast with the highs/ lows per year.
Interestingly, InvestingHaven’s research team has been spot-on with its gold price forecasts for 5 consecutive years. However, our gold forecast 2021 of 2200-2400 USD did not materialize. After 5 consecutive years of spot-on gold forecasts we did miss in 2021.
How comes?
In 2021 the intermarket readings were absolutely accurate; they justified a gold bull run. Bond yields did fall close to 40% at a certain point while the USD was rather flat. There was no gold bull run while any other point in time in the past gold would have been rallying in those circumstances.
This suggests that either our method stopped working OR our forecast is postponed. Eventually, it appeared that the market conditions which were created post Corona were so unique and extreme that all markets got messed up.
We remain convinced that our longstanding forecasted gold price targets will be hit, they may materialize with some delay.
This is an overview of our gold price forecasts from last years. We publish these forecasts many months prior to the year that we forecast. Prices reflect gold's spot price.| Year | Our gold forecast | Highs | Lows | Forecast accuracy |
|---|---|---|---|---|
| 2016 | Bearish with price testing 1,000 | 1,386 | 1,049 | Accurate |
| 2017 | Bearish with price testing 1,000 | 1,358 | 1,123 | Accurate |
| 2018 | Bearish with price testing 1,100 | 1,365 | 1,160 | Spot-on |
| 2019 | Bullish with price target of $1,550 | 1,556 | 1,265 | Spot-on |
| 2020 | Bullish with price target of $1,750 | 2,075 | 1,498 | Highly accurate |
| 2021 | Bullish with price target of $2,200 | 1,921 | 1,675 | Missed |
Weekly Gold & Silver Price Analysis
Our public blog posts typically share high level insights that are not actionable. For actionable insights, we recommend considering our detailed gold & silver price analysis. It is a premium service, covering leading indicators of the gold price and silver price. Premium service: Gold & silver price analysis >>
Must-Read 2024 Predictions
We recommend you read our 2024 predictions as they are very well researched:


