[Ed. note: We are not used to do Elliott Wave analysis on InvestingHaven.com. We give analyst Tola Ogunniyi a chance to prove his technical analysis skills, this Ripple price analysis is the first in a series of similar articles.]
Summary for Ripple’s Elliot Wave price analysis on the 4 hour timeframe on April 30th:
- Ripple (XRPUSD) should return to support level between ~$0.71 and $0.74 before any bullish move can be sustained
- The current market action for XRPUSD (XRP) after closing at ~$0.92 on April 20, 2018 can be described as a W-X-Y combination Elliott wave structure
- Point of invalidation (POI) for the analysis is a price close above ~$0.99
Ripple’s (XRPUSD) price action has remained in a sideways trend after it closed at ~$0.92 on April 20, 2018. Ripple’s (XRPUSD) meandering price action after April 20 is identified in this analysis to be a combination (W-X-Y) Elliott wave structure with Minute wave ((x)) currently ongoing.
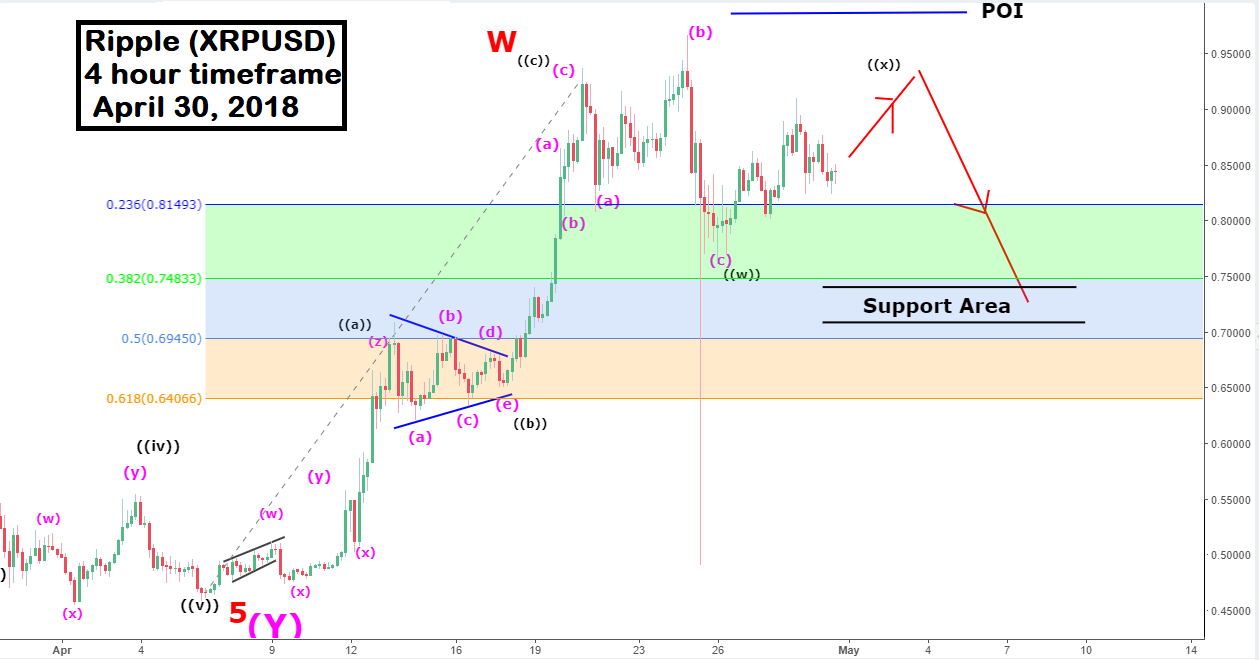
The implication of the above is that a Minute wave ((y)) should finish downwards as indicated by the red arrow on the 4hr tf chart for Ripple (XRPUSD) before a bullish move can be sustained. This analysis favors Ripple (XRPUSD) targeting between 38.2% and 50% retracement of the previous upswing (i.e. Minor wave W).
The 38.2% and 50% retracement lies approximately between ~$0.70 and $0.74, which is coincident with the region of technical support for Ripple (XRPUSD) between ~$0.71 and ~$0.74 as indicated by the horizontal black line. The use of two separate evidences thus increases the chance of Ripple (XRPUSD) reaching the $0.70 area.
Point of invalidation (POI) is placed just above the high of ~$0.97 reached on April 24, 2018. POI in this case is a price close above $0.99.


