There are too many differences between 2008 and 2022 with only one similarity. We do not expect a market crash similar to the one in 2008. Many are anxious about the next next lower in markets to start soon, not later than early 2023. Many followers and members reached out with this concern in recent weeks. Although we published quite some data points in our no stock market crash in 2023 article it looks there is more evidence required for our followers. The data points included in this article make us conclude that the market will not move lower even if the market feels ugly right now. This is one of the recurring conclusions in our 2023 forecasts, consistent with the insights from the 100 year Dow Jones chart.
[Ed. note: On December 24th, our team added another section with more charts about the 2008 situation. As seen in point #6 the rounded patterns back in 2008 broke entirely. They did so around specific periods of the pattern. The bears had an opportunity to break a similar pattern in 2022 but did not succeed in doing so.]
We look at 2 chart comparisons, 3 fundamental data points and one anecdotal data point in this article. We conclude that things feel bad but aren’t factually bad (on the contrary, in fact).
1/ SPX in 2008 vs. 2022
First, let’s compare the SPX charts: 2008 vs. 2022.
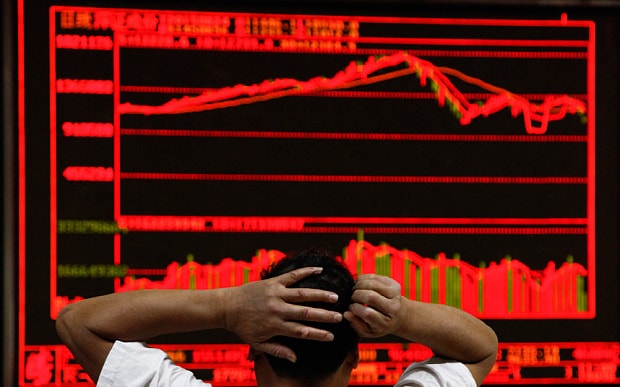
The 2008 crash came with a structural breakdown of a key horizontal level, it happened in September of 2008 when 123 points in SPY ETF gave up. The bounce that occurred in August from that level was very weak, the triple bottom did not hold.
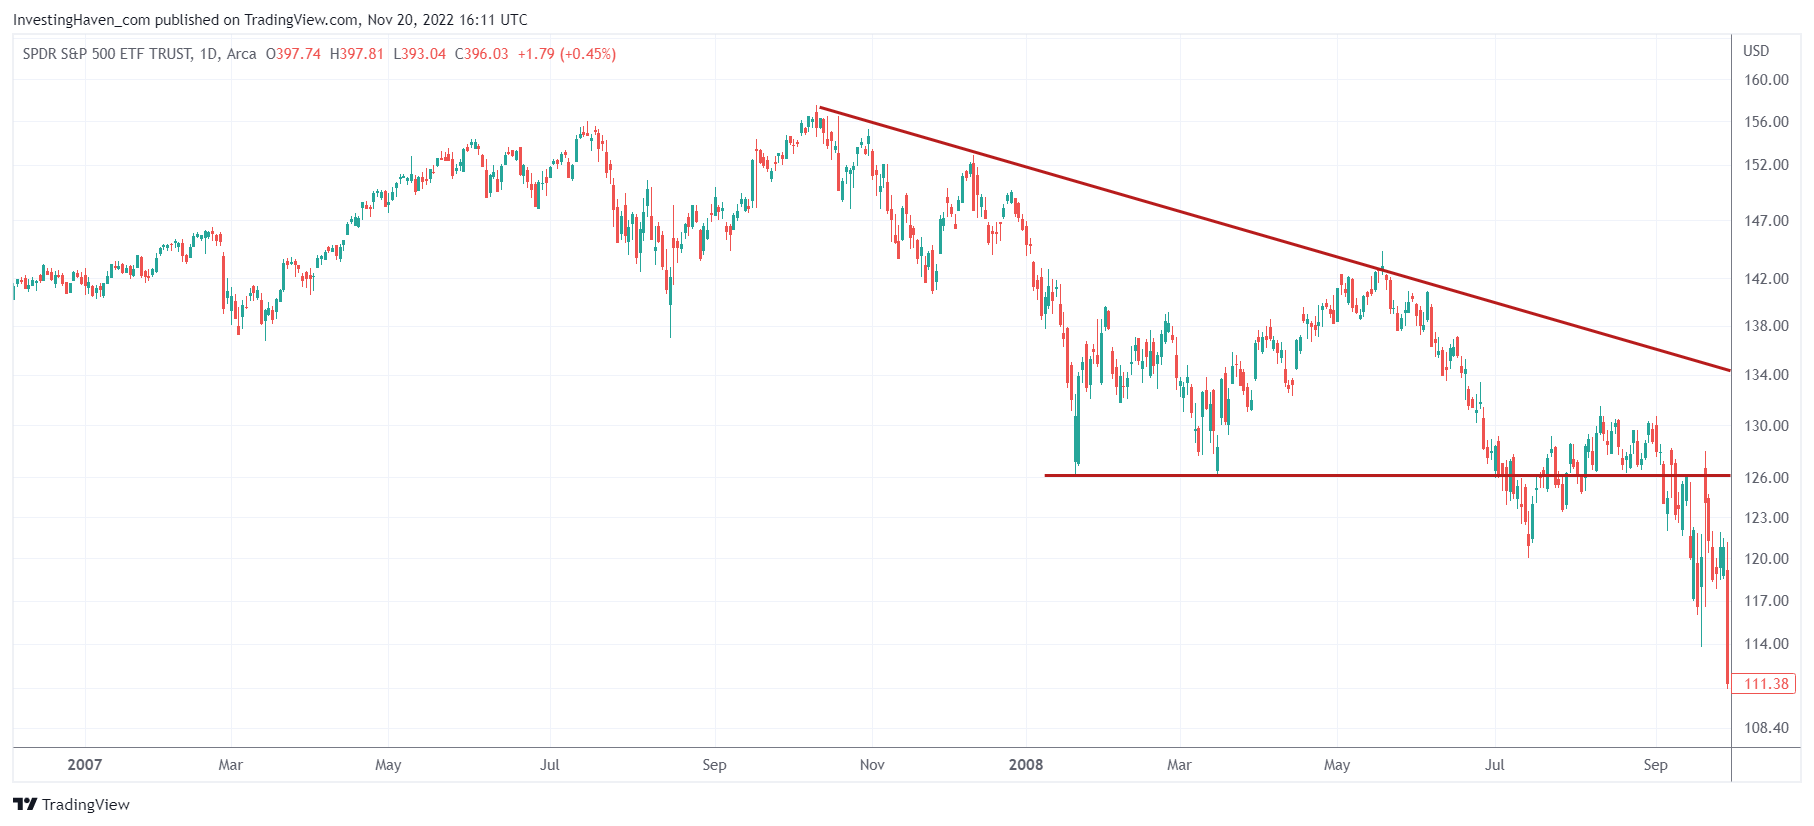
This is the leg lower from 122 points to 68 points, between August of 2008 and March of 2009.
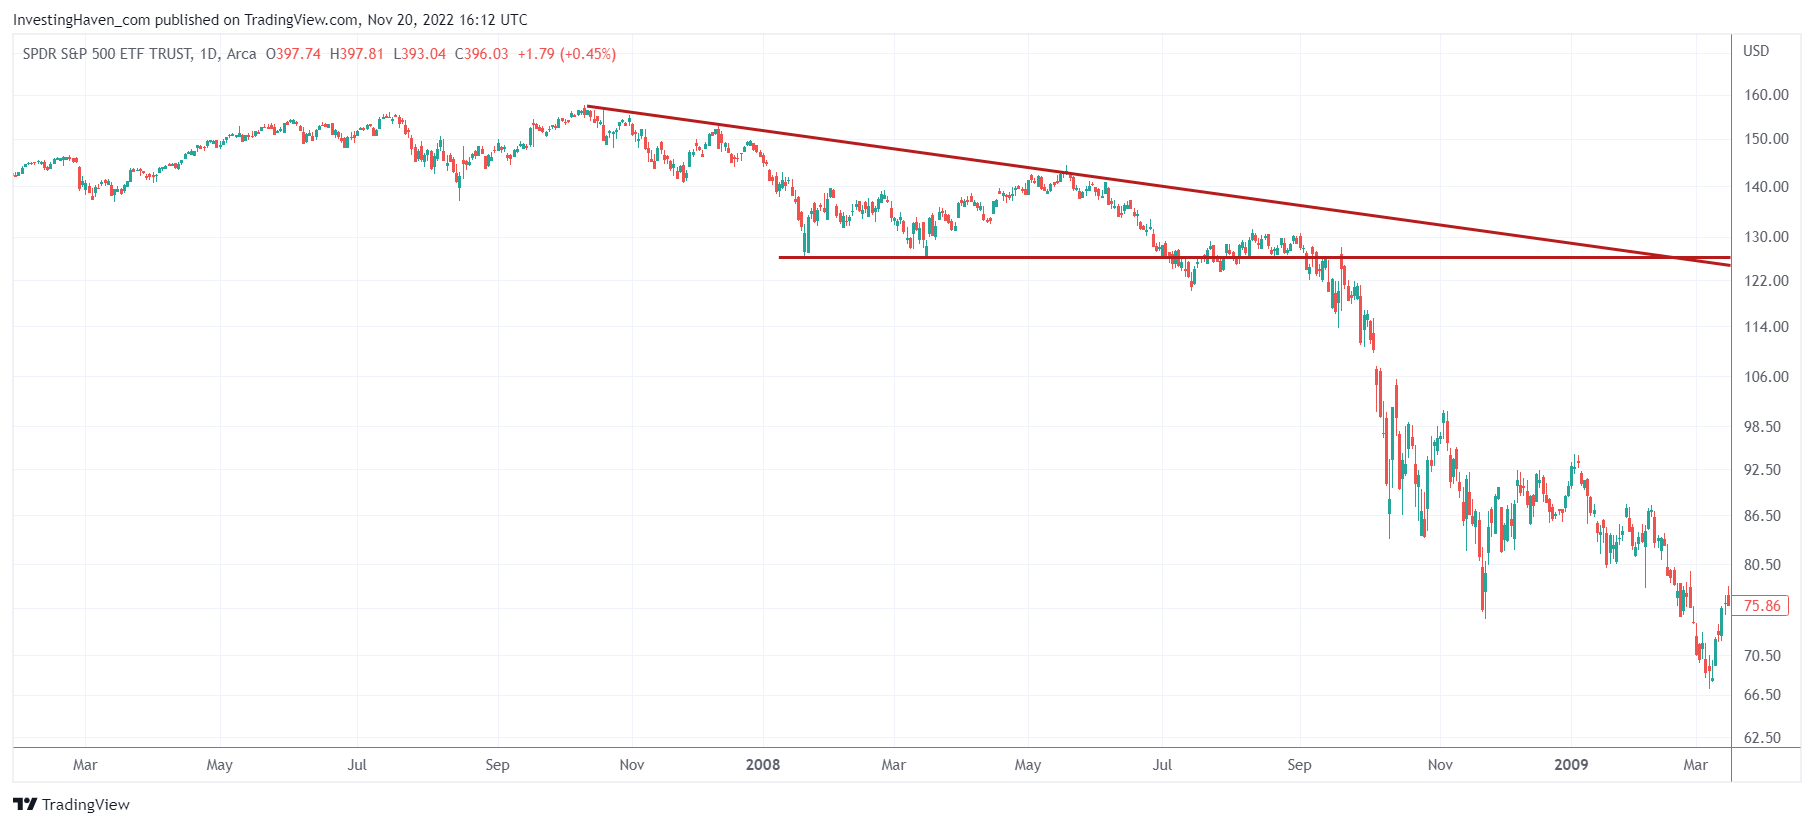
In 2022, the bounce from the double bottom at 360 points is pretty strong.
- The similarities between 2008 and 2022: the multi-month falling trendline not cleared (not yet).
- The differences between 2008 and 2022: the bounce from the double bottom was very weak back then but much stronger right now.
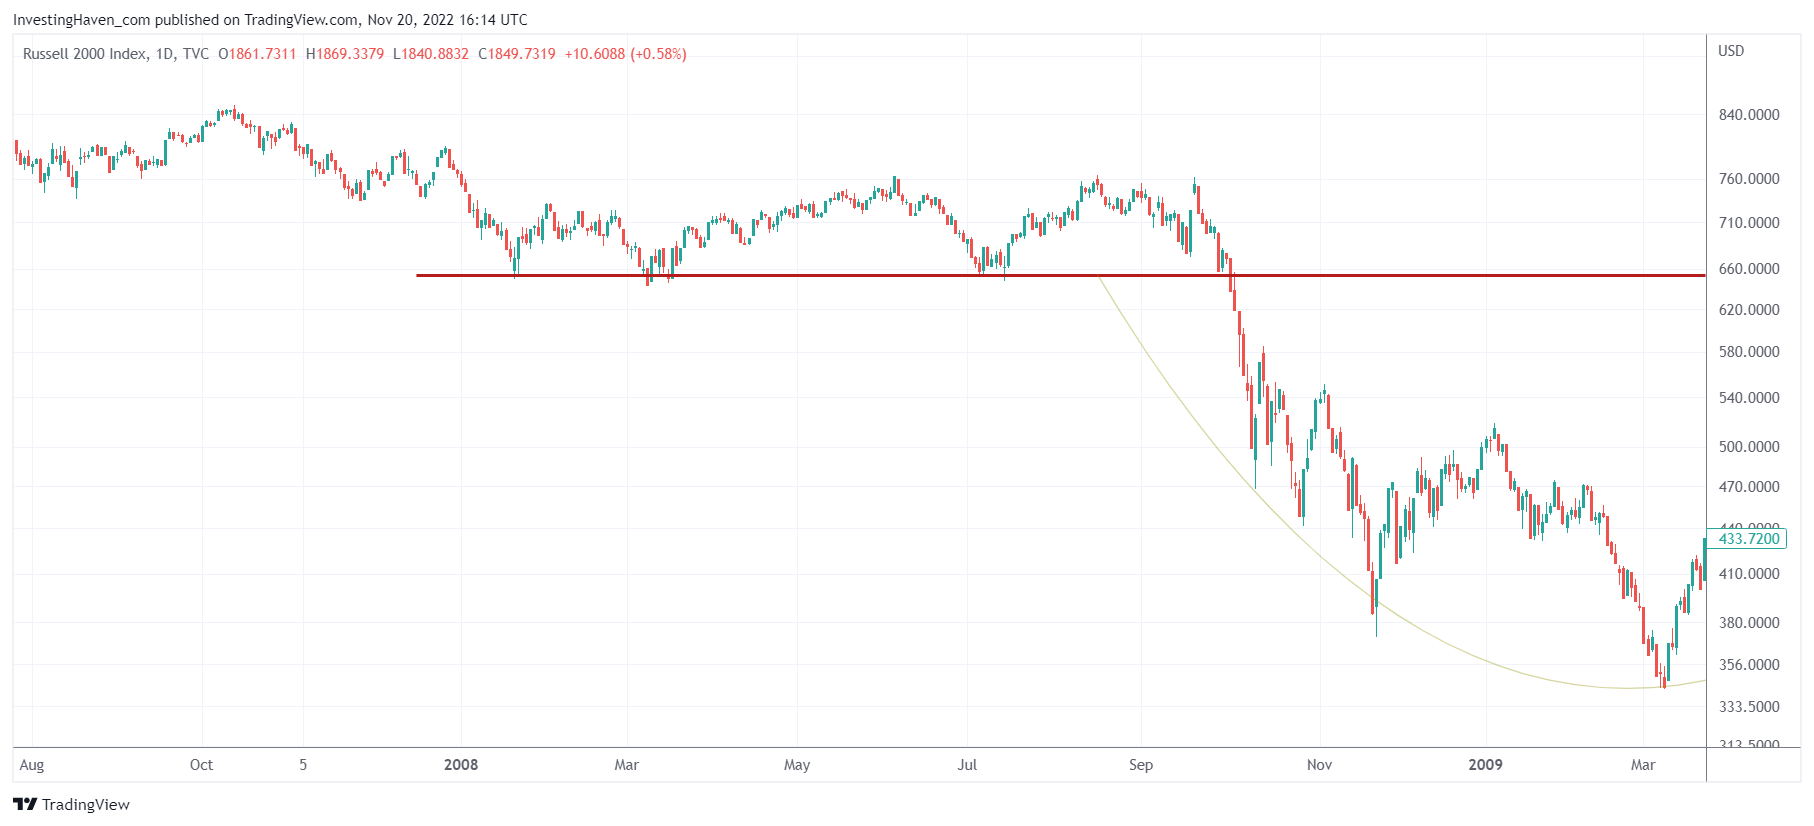
2/ Small caps in 2008 vs. 2022
If anything, small caps are the market segment to lead the market lower. There is no way that small caps will hold strong if the market is bearish, on the contrary.
In 2008, the Russell 2000 index was trading in a very narrow range before it brake down and went down fast in Sept/Oct of that year.
In 2022, we can see that the Russell 2000 has established a strong double bottom after it gave up support at 2101 points back in January and May.
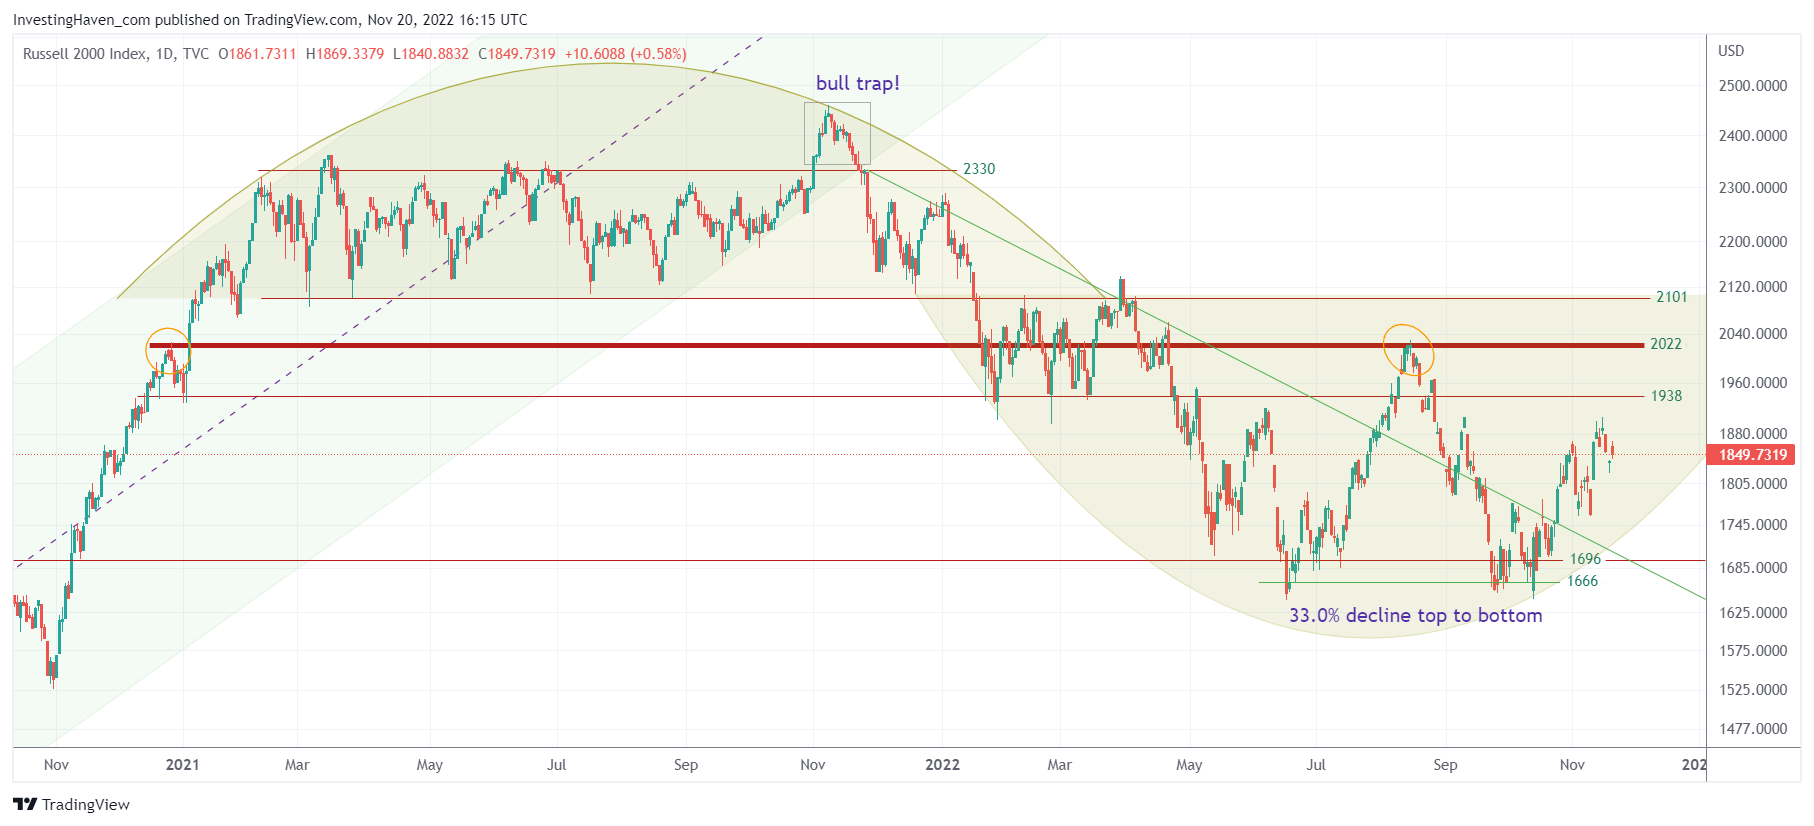
- The similarities between 2008 and 2022: the Russell 2000 index is weak when the market is bearish.
- The differences between 2008 and 2022: the current double bottom structure is very strong, much stronger.
3/ Credit spread 2008 vs. 2022
When a bear market is about to pick up in speed, it will be visible in the credit market.
A yield spread is the ultimate proof of more pain ahead.
At present day, spread between the high-yield corporate bond composite and the 10-year US Treasury has widened from 279bps at the start of this year to 499bps recently. However, it isn’t spiking higher the way it did during previous credit crunches.
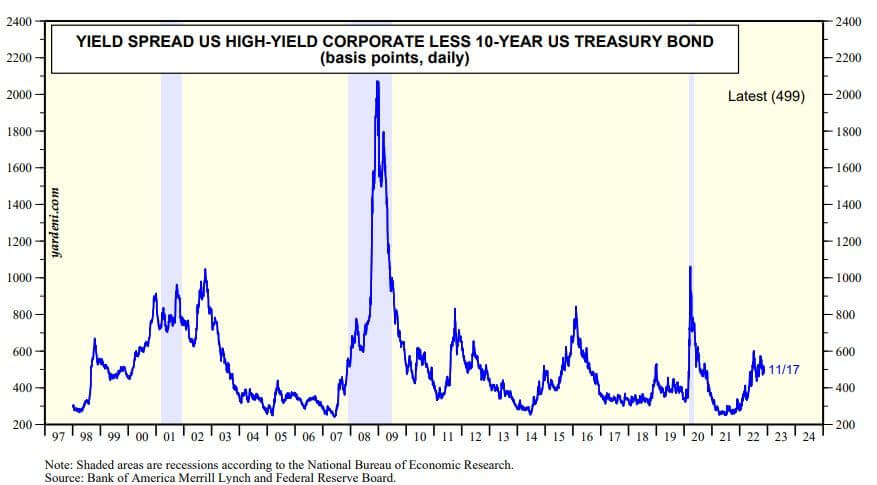
- The similarities between 2008 and 2022: a move higher in the yield spread.
- The differences between 2008 and 2022: no continuation, there was plenty of opportunity for this spread to move substantially higher in 2022 but it did not happen, there is no credit crunch.
4/ Consumer sentiment in 2008 vs. 2022
Consumer Sentiment sits at low levels. However, even if consumers remain depressed, emotionally, it does not translate into their shopping behavior. It’s quite the opposite in fact, consumers continue shopping as evidenced by the retail sales chart.
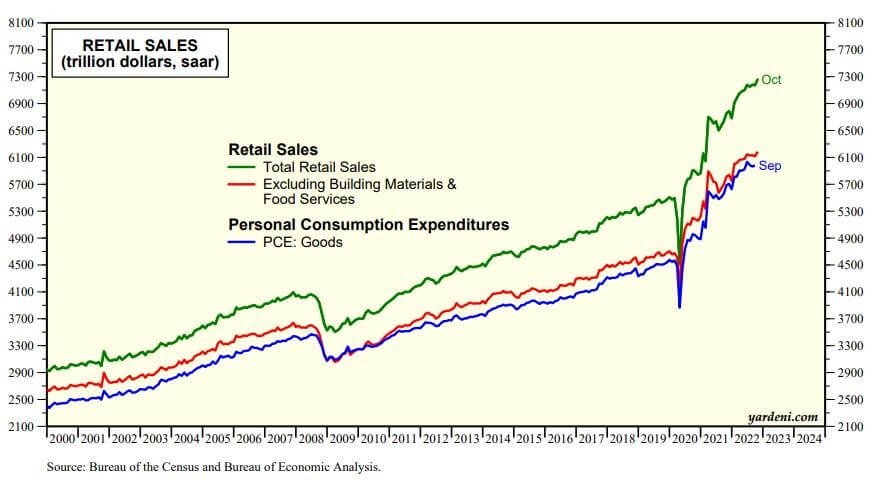
- The similarities between 2008 and 2022: none.
- The differences between 2008 and 2022: continued consumer spending in 2022.
5/ The US Dollar in 2008 vs. 2022
One of the most confusing phenomena in 2022 is the underlying reason of strength in the USD. On the one hand, the USD has been rising as a safe haven. However, the USD has been rising as well because of its attractiveness against other markets globally.
What this really means is that, once risk appetite returns, those massive amounts of U.S. Dollars will make it into the market (from cash to risk assets).
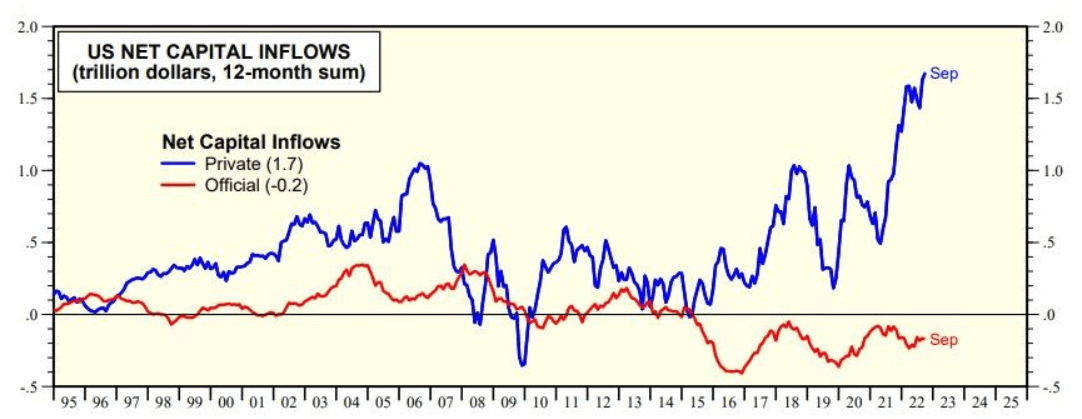
- The similarities between 2008 and 2022: Only safe haven demand for USD.
- The differences between 2008 and 2022: Both safe haven and investor demand from around the globe (with the intention to deploy those dollars later).
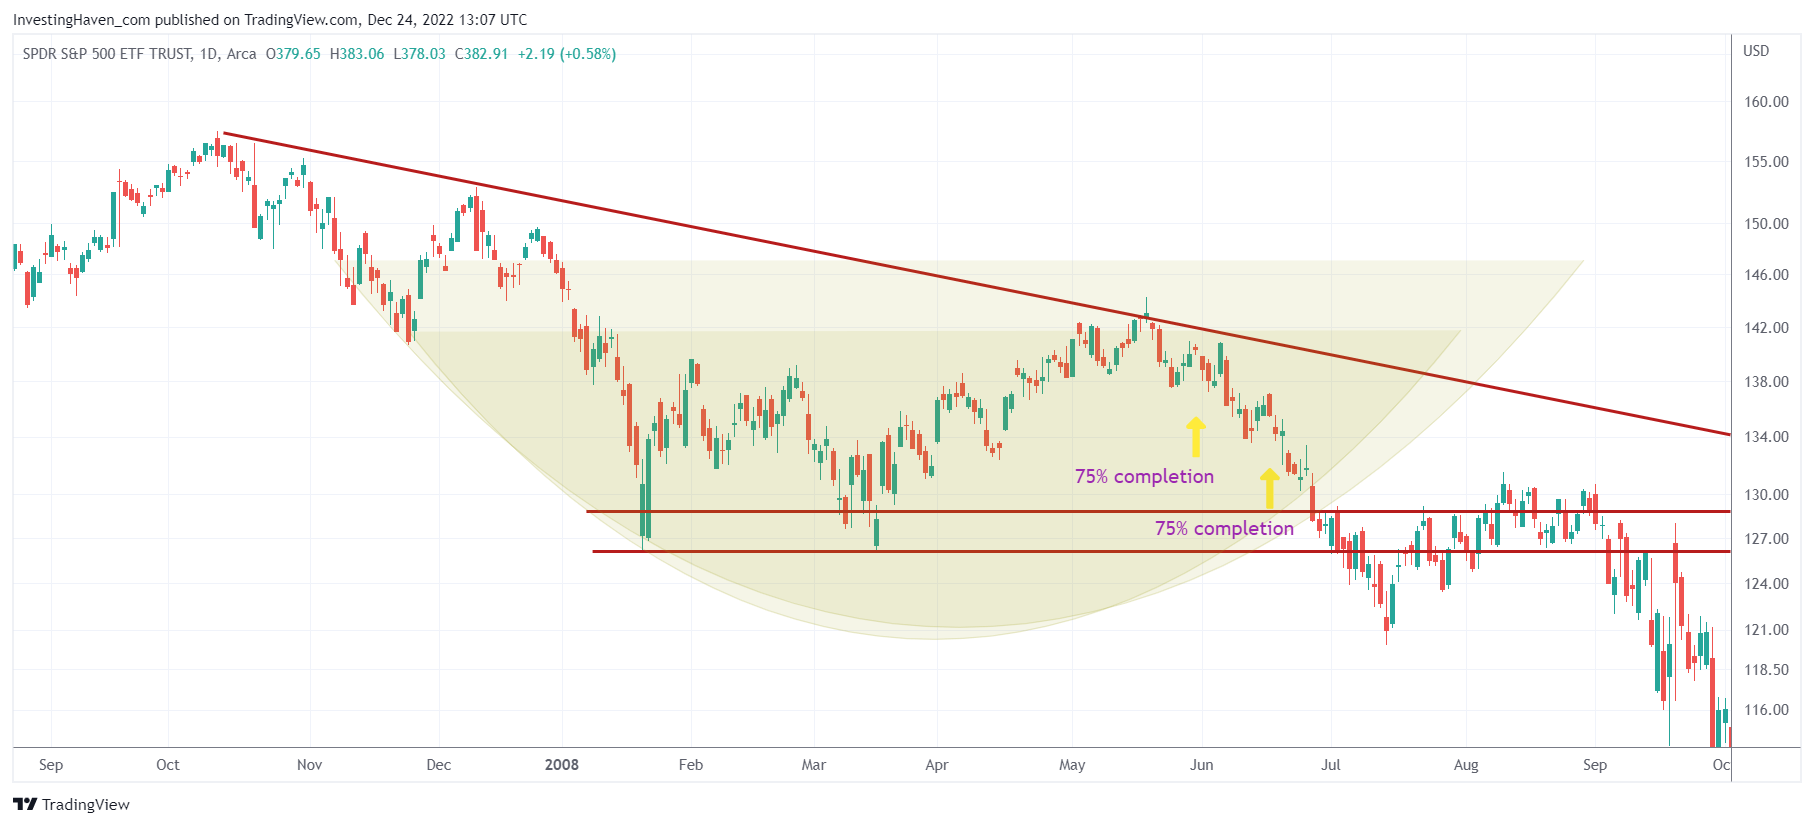
6/ Rounded chart patterns: they broke back in 2008, not so in 2022
From our latest Momentum Investing alert, shared on Dec 24th: Must-See Charts – 2008 Comparisons:
The 75% completion of rounded patterns are crucial. It’s where decisions are made. Sometimes the exact same day, very often in the 75% to 90% completion area.
The S&P 500 chart broke down arguably one week after its 75% completion. Exactly 3 months later the big market crash started.
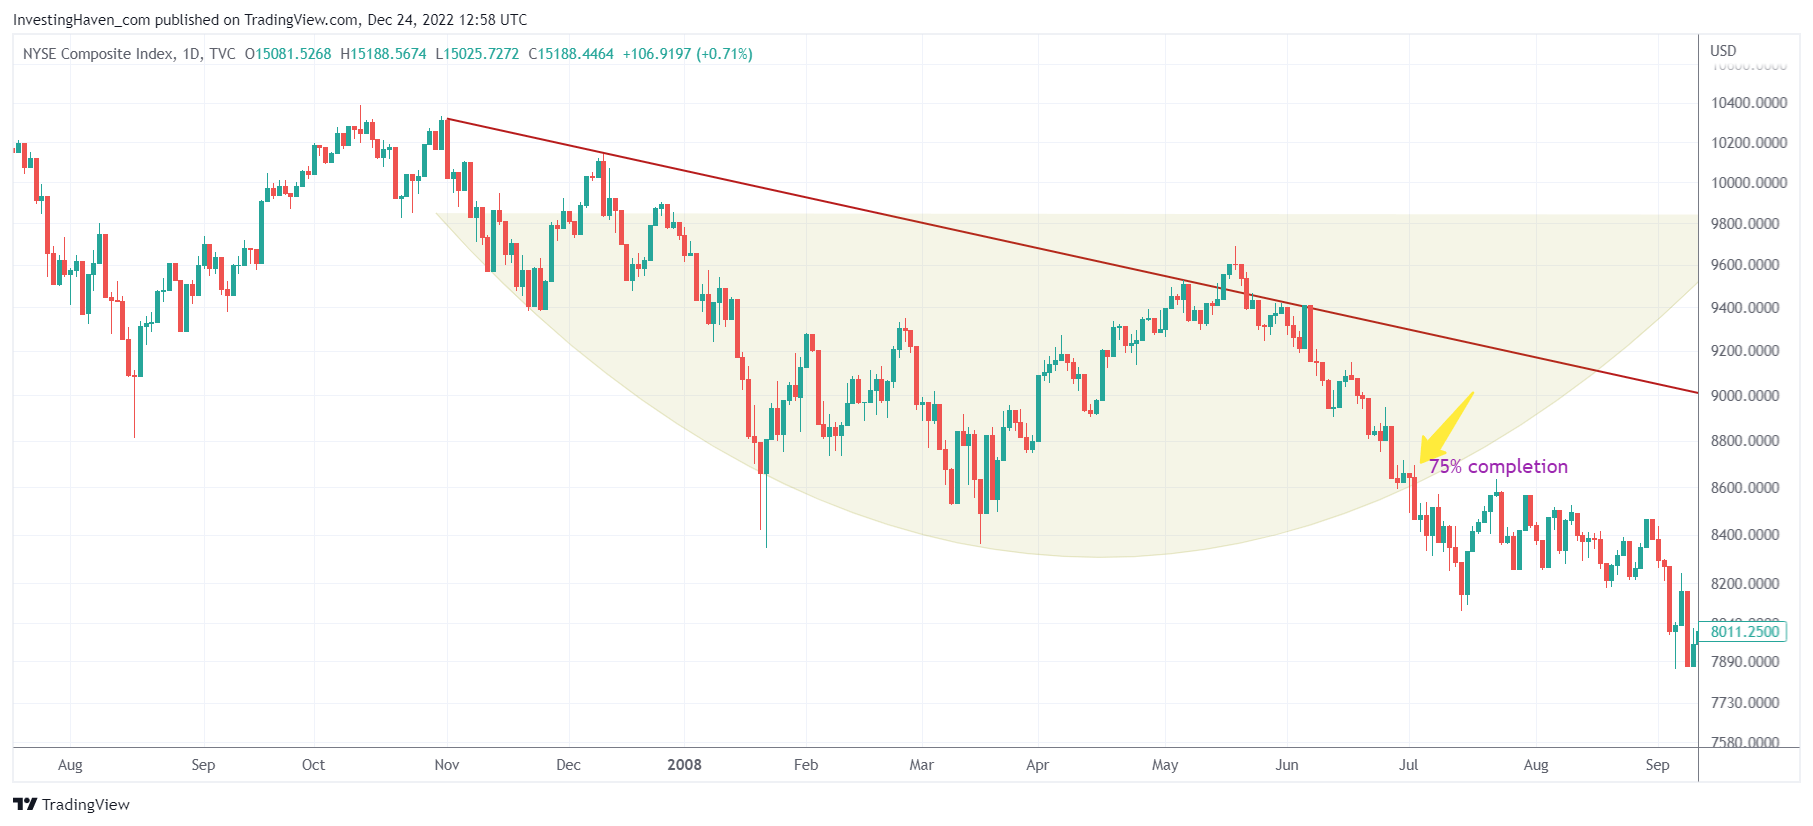
The NYSE Composite Index chart broke down exactly the day of its 75% completion. It was a precise as it could be. It was the ultimate confirmation that a market crash was underway!
The Nasdaq chart help up pretty well, even at 75% completion. After it tried to move higher and found resistance at the falling trendline, around 90% completion of its rounded pattern, the big downtrend and market crash started.
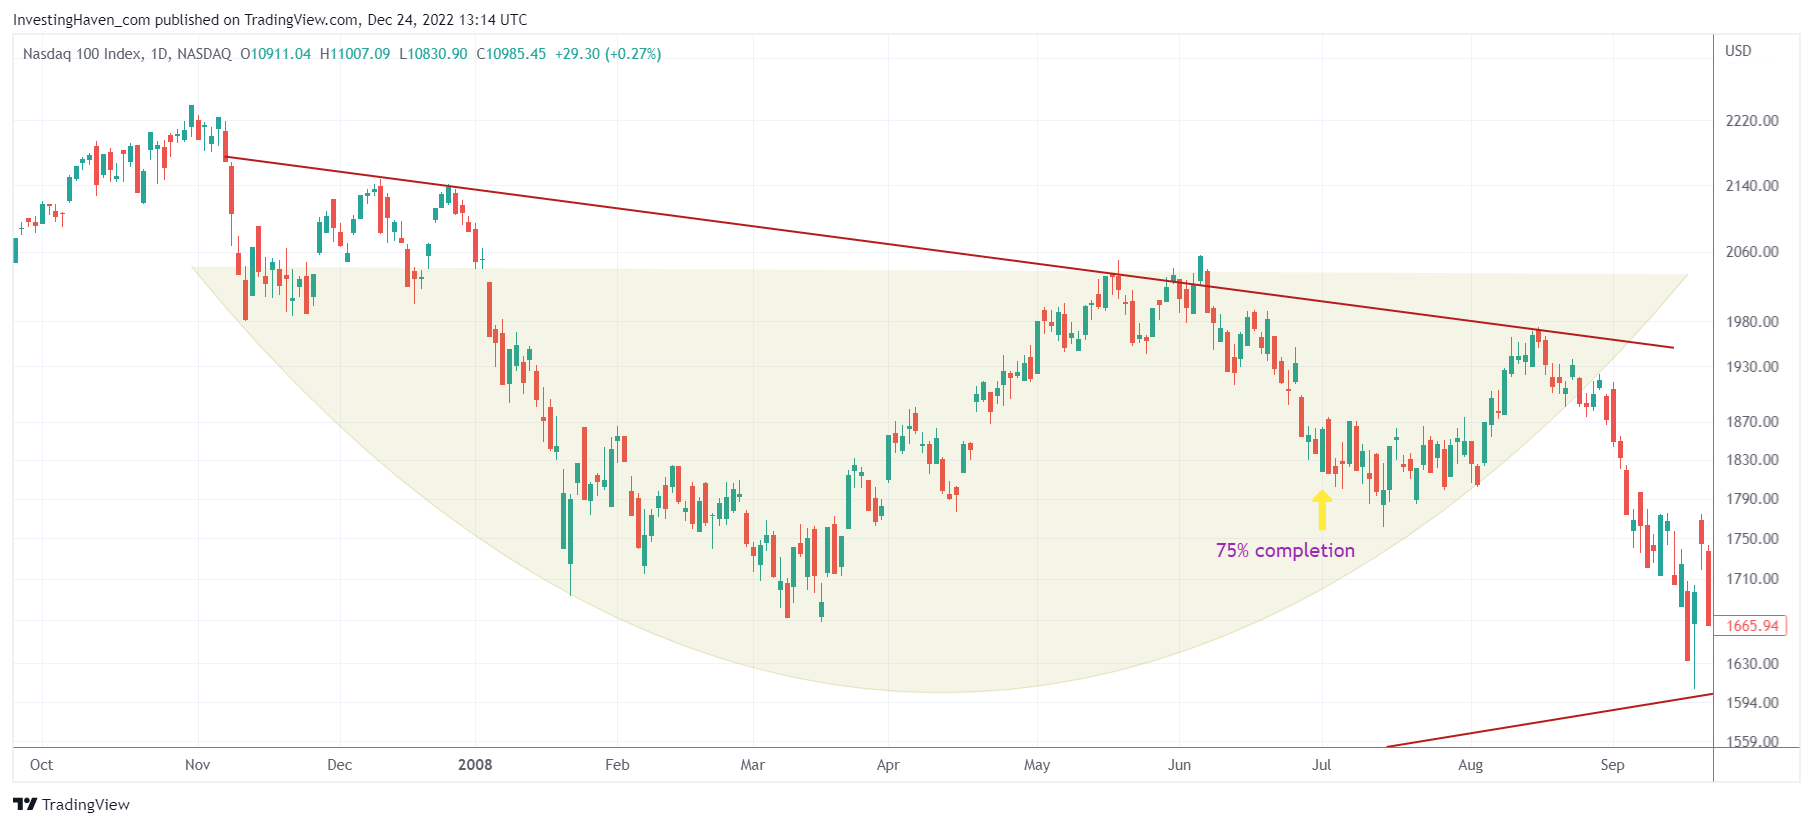
The Dow Jones set a lower low 3 weeks before it got to its 75% completion.
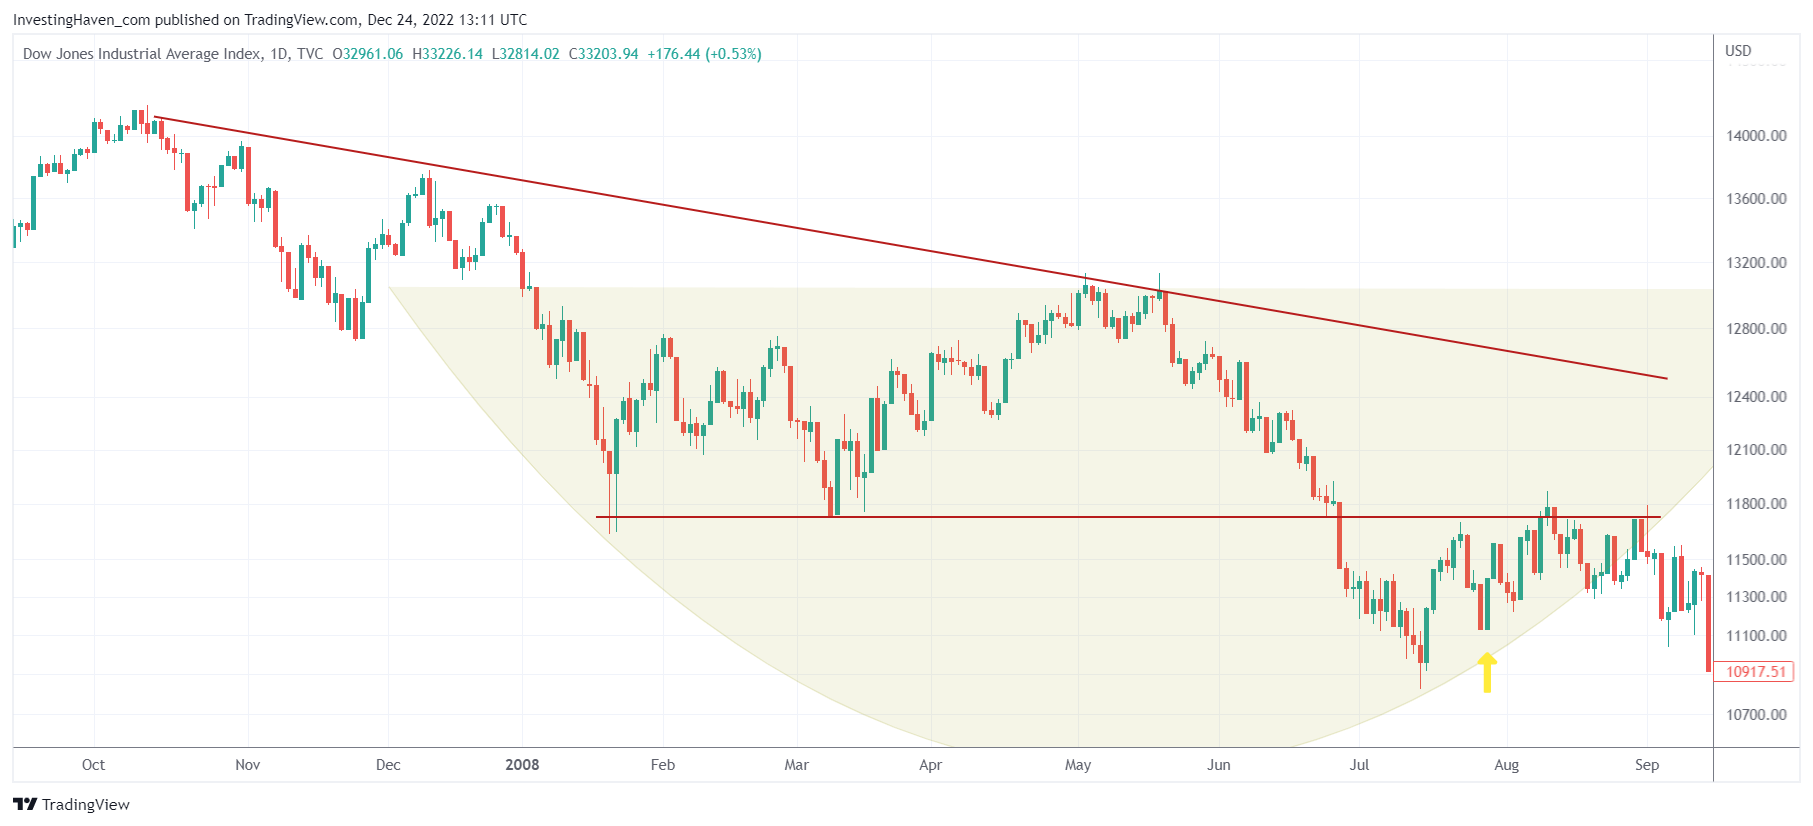
These charts make the point that the situation in 2008 was much worse when it comes to the charts of leading indexes. Yes, the similarity is the falling trendline but the support structures and chart patterns are vastly different.
In our latest Momentum Investing alert we shared details about the dates to watch for a final confirmation that a market crash is / is not upon us, see below for more details.
If you are a stock market investor and like our work, you can sign up to Momentum Investing and receive much more of this that we never share in the public domain. You’ll have instant access to the Momentum Investing alert shared on Dec 24th: Must-See Charts: Q1/2023 Will Be Crucial, 7 Timing Conclusions, 2008 Comparisons.
In the meantime, instead of being concerned and anxious, you may want to prefer letting our algorithm do the hard work for you by auto-trading the S&P 500 >>


