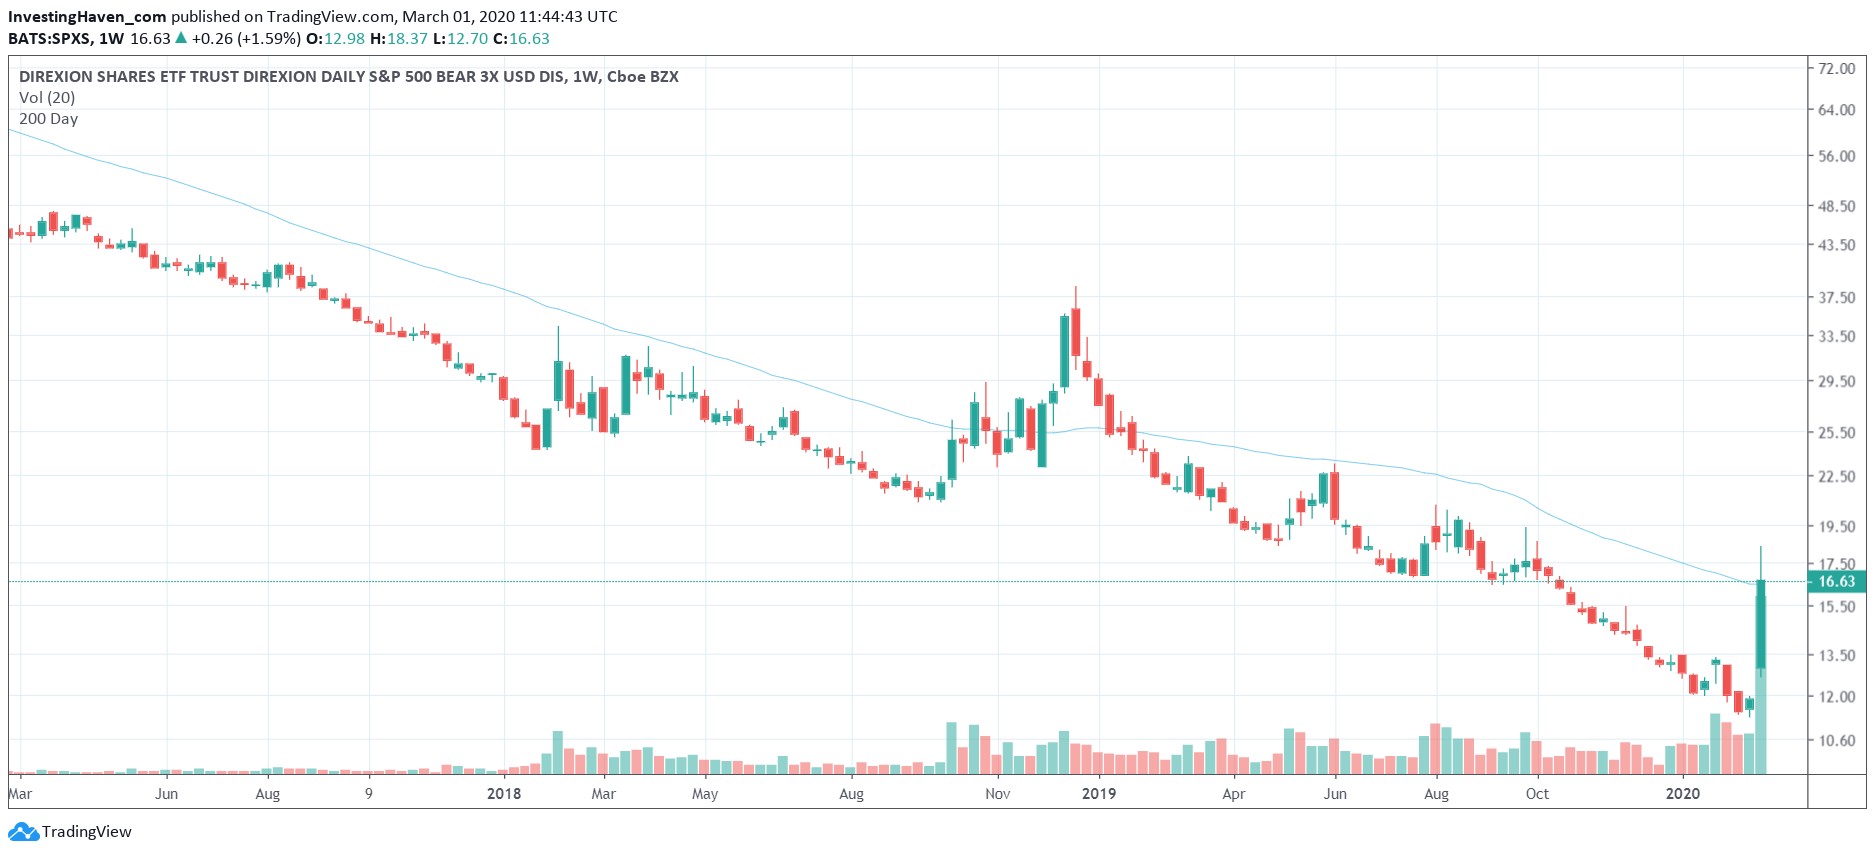
Markets wrote history last week. The fastest decline in U.S. stock indexes ever right after hitting all-time highs. Never before did indexes decline so fast. The big risk right now is the narrative. The corona narrative is one that is ugly market conditions go hand in hand with corona spread. The more viral corona goes, the bigger the market losses. We are not convinced that’s the case because one of our leading indicators is hitting peak fear. This mostly is not a time to sell. Our bullish Dow Jones forecast is still valid, our biotechnology forecast is visibly delayed, and it is questionable that our stock market crash forecast for 2022 is already here.
What’s important in these conditions is to be extra sharp in understanding what exactly is happening, and what not.
Obviously the one single biggest source of is financial media. They are happy to associate this week’s sell off with corona. The more viral corona goes the steeper markets go down.
Corona may have played a role in last week’s historic sell off. However it is certainly not THE reason, and there certainly is no correlation between the extent of this virus going viral and the depth of markets selling off.
We are on record saying that we have reached limits of the sell off. There is some downside, but not immediate. This does not tell anything about continued selling later this year, it only tells something about the next few days and weeks (ultimately a few months out).
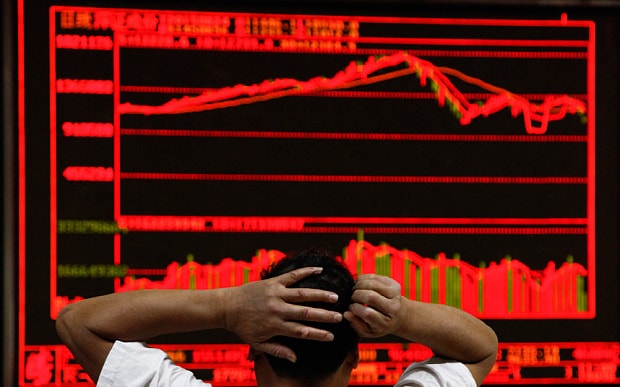
The reason why we believe selling is over (for now) is that the Dow Jones 11 year uptrend got tested this week, exactly at support of its 11 year bull market.
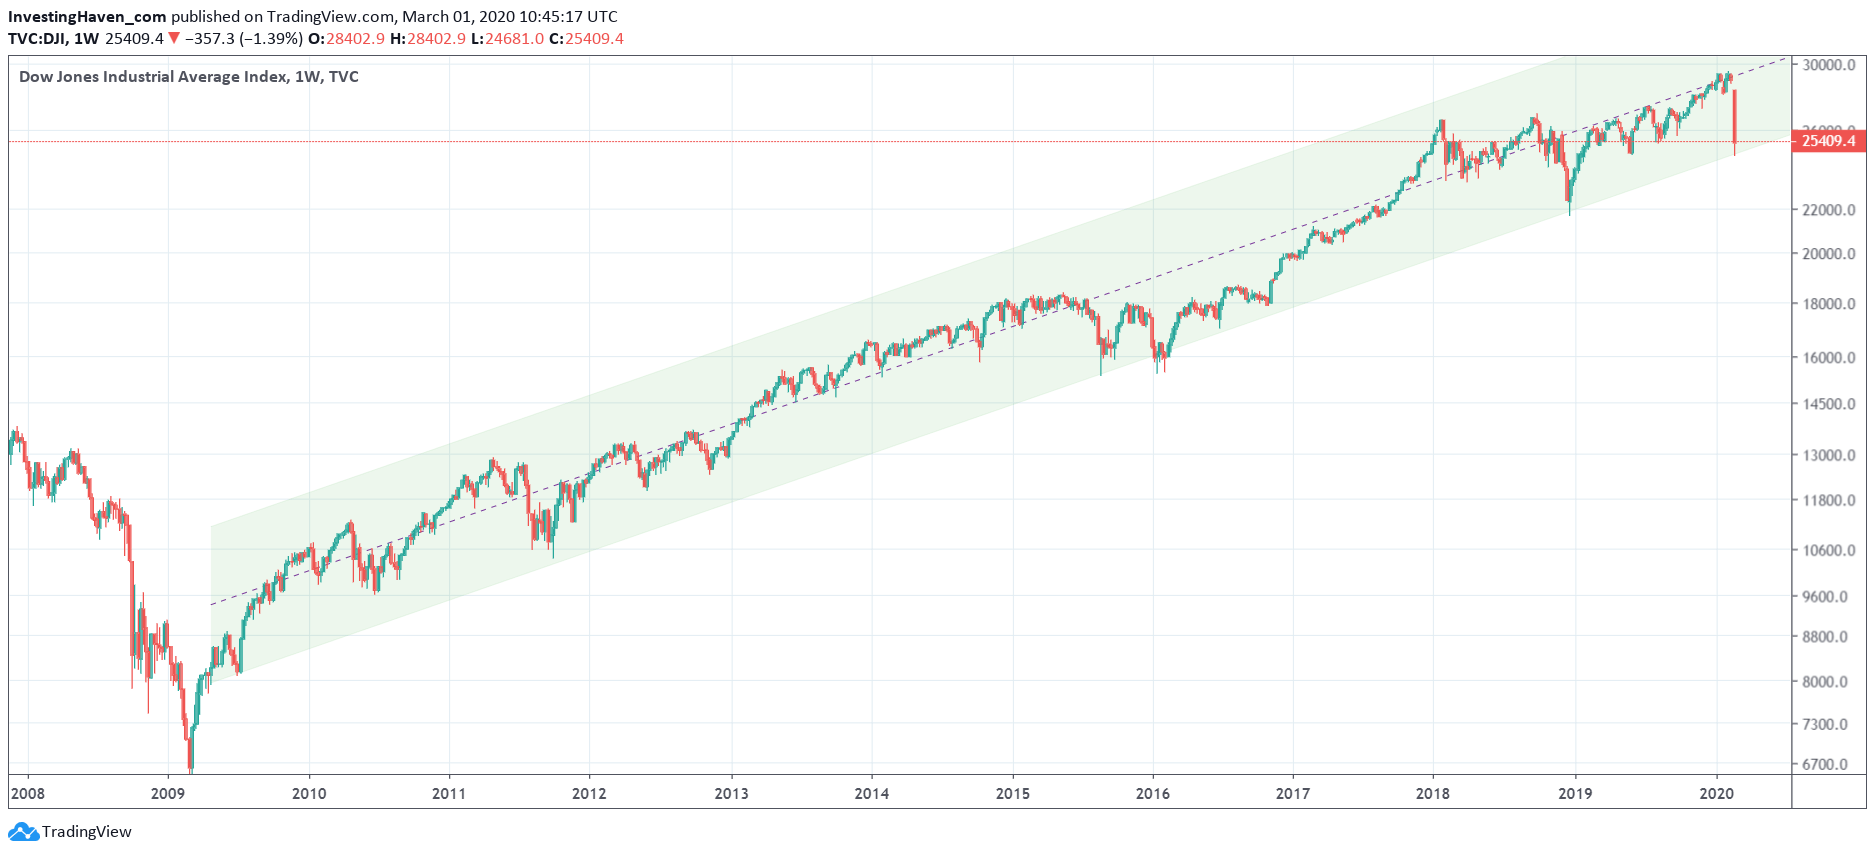
If we take a close up, specifically in the S&P500, we see that January 2018 highs were tested on Friday Feb 27th, 2020. For now this qualifies as a successful breakout test.
This chart also suggests it’s a time to buy, not to sell. But be careful with another test of the same level later this year.
Ed. note: in our Momentum Investing service we feature a chart that will not be share in the public domain. It’s only for premium subscribers. The chart features a pattern that may forecast when the next mini-crash (like the one last week hits). We will use this chart as our guide for 2020, and we will be ahead of the game if and when another crash like the one last week will hit.
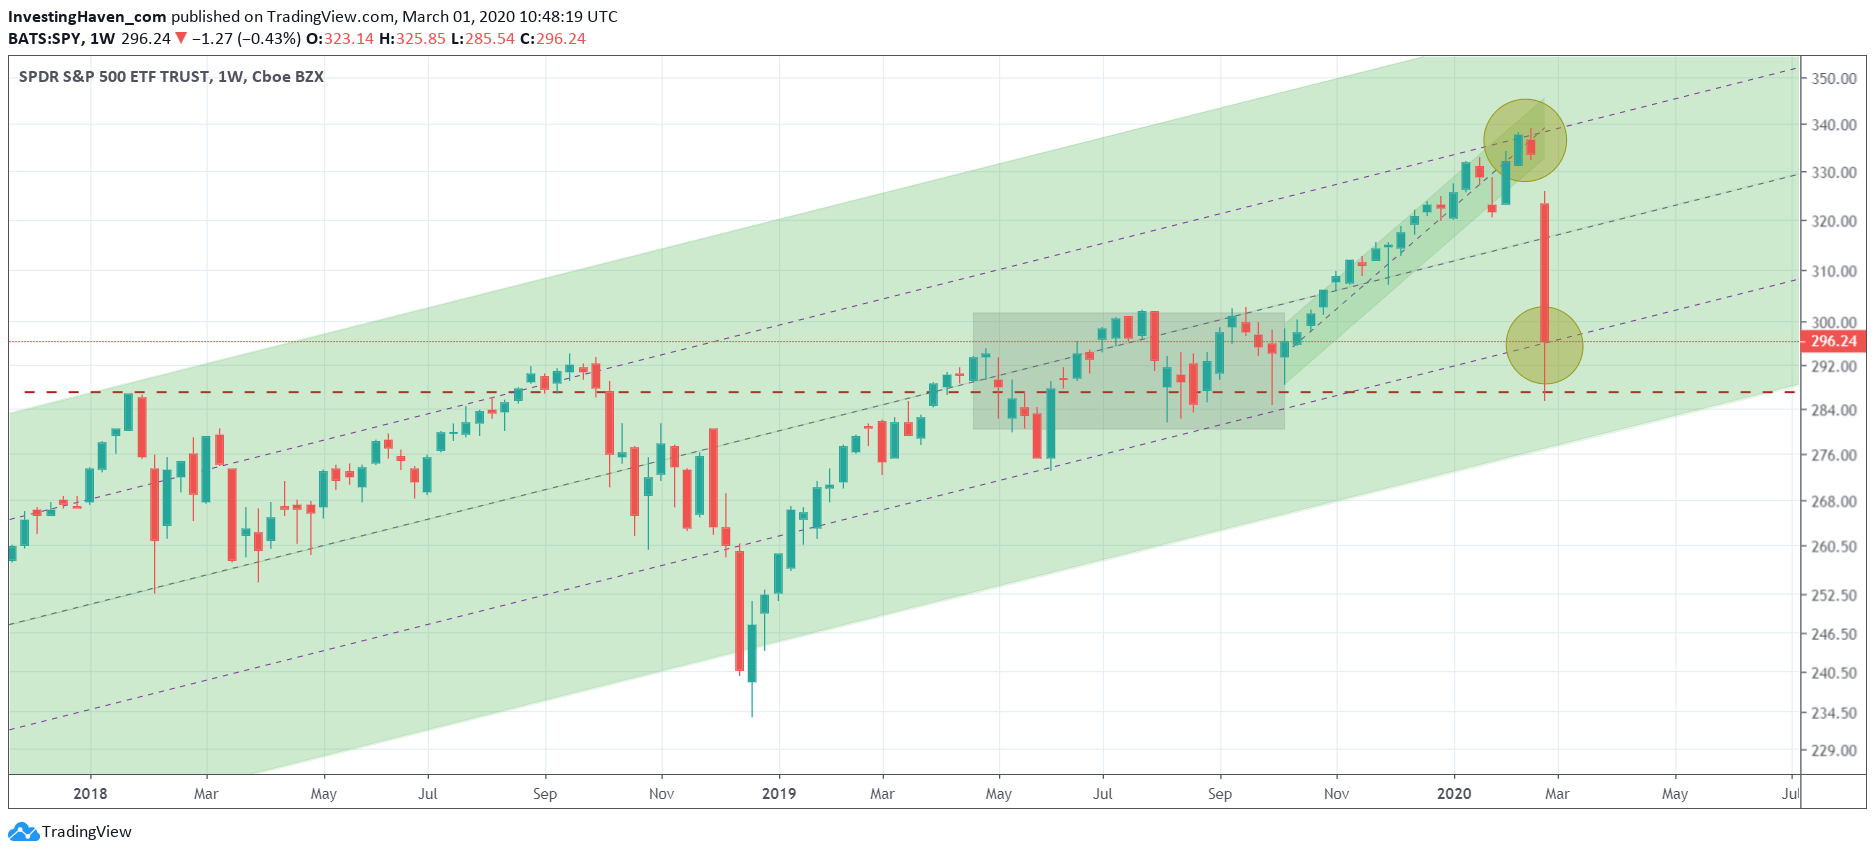
The very important crash chart is the one on the inverse ETF SPXS. Clearly what stood out this week was the absolutely historic inflow in inverse ETFs. InvestingHaven’s team made a calculation, and found out that the inflow in inverse ETFs this week, on a daily basis, exceeded regular trading days in individual U.S. stock indexes.
It was huge, we call it the ‘quick short’, and we have found a way to identify when this will come again and how we can make astonishing profits from it.
Ed. note: in our Trade Alerts service we registered a profit of 16.93% this week. Yes we showed to be able to profit from this epic and historic decline this week. We did not book similar profits in our emerging markets ETF because that market was too risky heading up to this week. We also worked out a special crash methodology as part of our Trade Alerts service to profit between 30 and 40 pct next week a similar event takes place.
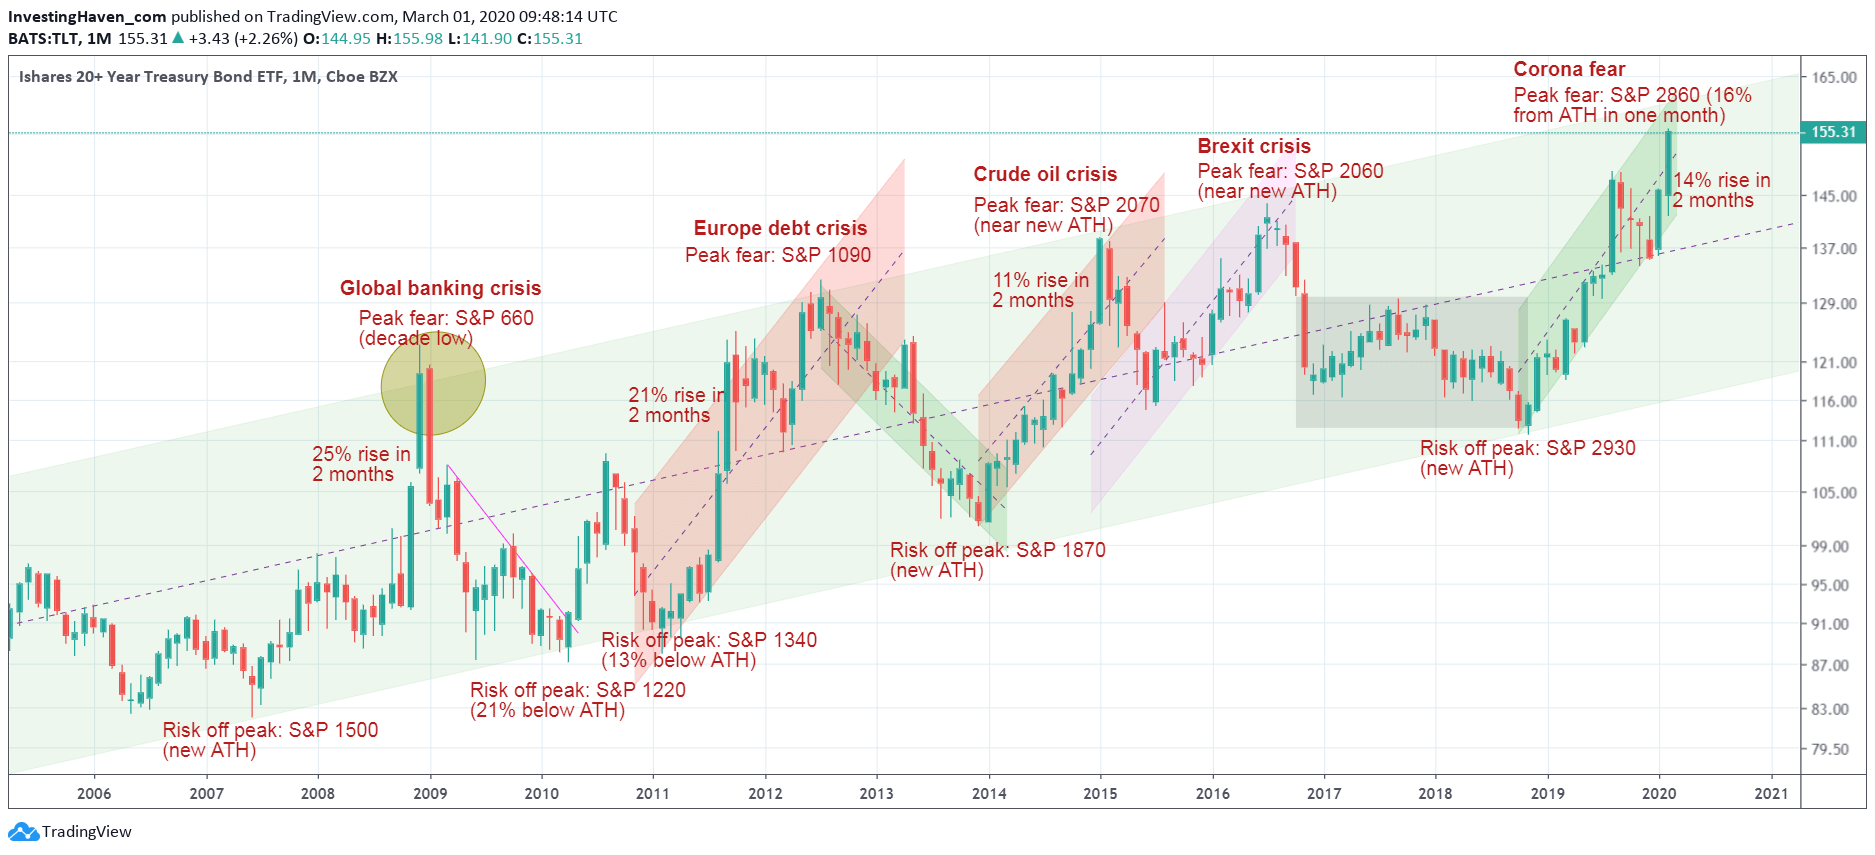
The next chart is the peak fear chart. It shows how this is the 5th time that fear peaked in the last 11 years.
It also it a stretch indicator: it shows when fear peaked that selling was exhausting. We are near that point. It doesn’t tell whether selling will return in a few months, it just tells us, combined with the other charts, that selling in the short term is over.
Ed. note: We have worked day and night to include this crash scenario which we call THE QUICK SHORT in our methodologies, both our short term trades as well as our medium term investments. Our portfolios did very well against the indexes: in one short term trading category we booked 16% profits, in the other one 1.6% loss, and the momentum investing a 2% loss. Both are set up to profit from the rebound we expect. So InvestingHaven members should largely outperform 90% of other investors.


