One week ago, when markets were breaking down and the gurus were forecasting that a stock market crash was inevitable, we published The Market Will Not Move 50% Lower. In fact, we looked at our leading indicators and concluded that Volatility Indexes Suggest A Short Term Bounce In Markets Is Underway. In this short post, we share an update of where volatility indexes stand and, in doing so, share a few quotes and charts from our most recent market analysis shared with premium members in our Trade Alerts service.
In our Trade Alerts service we offer a few proprietary methods:
- An algorithm that flashes highly accurate signals for trading the S&P 500.
- A method to read volatility indexes to forecast the direction of markets (short to medium term oriented).
Interestingly, our Trade Alerts method can be used not only for trading but also to understand the direction of the market direction, particularly through volatility index readings and signals from our algorithm.
What we noticed this weekend is really interesting and worth sharing in this public post: our bullish buy signal occurred at a critical point on the charts of volatility indexes. Moreover, it was confirmed on both SPX charts. Needless to say, this is relevant information for any market participant, not just short term traders.
Let’s pick out two charts to illustrate what we observed.
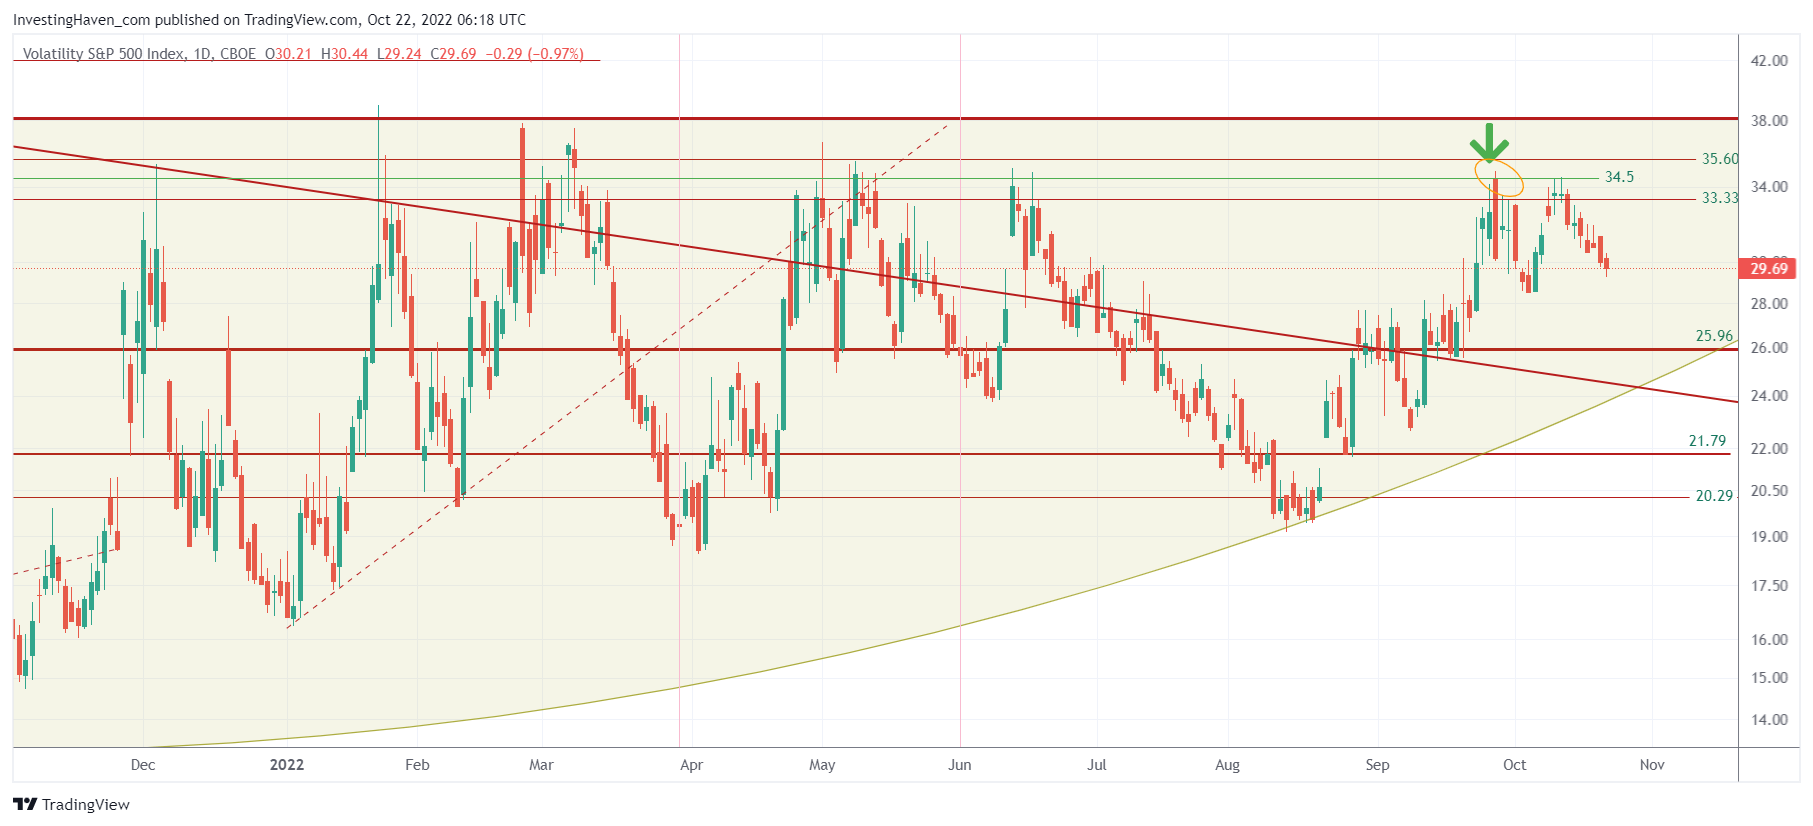
First, one of the 6 the volatility index charts we track is VIX. This is what we wrote in our latest market report:
“VIX has a very similar setup as the Nasdaq volatility index. We like the double top pattern a lot. Also, remember that our conviction of a bottom formation in markets primarily came from VIX topping right below 35 points on Sept 28th, green arrow on the next chart. It worked like clockwork.”
Based on our volatility index analysis we concluded the following:
- Volatility indexes, once again, guided us very well in reading markets, despite the very aggressive bottoming formation in markets that took one full month to complete.
- We like the setups in volatility indexes, a lot, they confirm that a bottom in markets is set.
- Because of this, we expect markets to resolve higher.
It becomes really interesting when we look at our trade-able S&P 500 chart, also a key component of our Trade Alerts weekend alerts.
The 3x bullish S&P 500 ETF chart is in the process of to confirming a huge reversal. Below is the short term SPXL chart which makes the point.
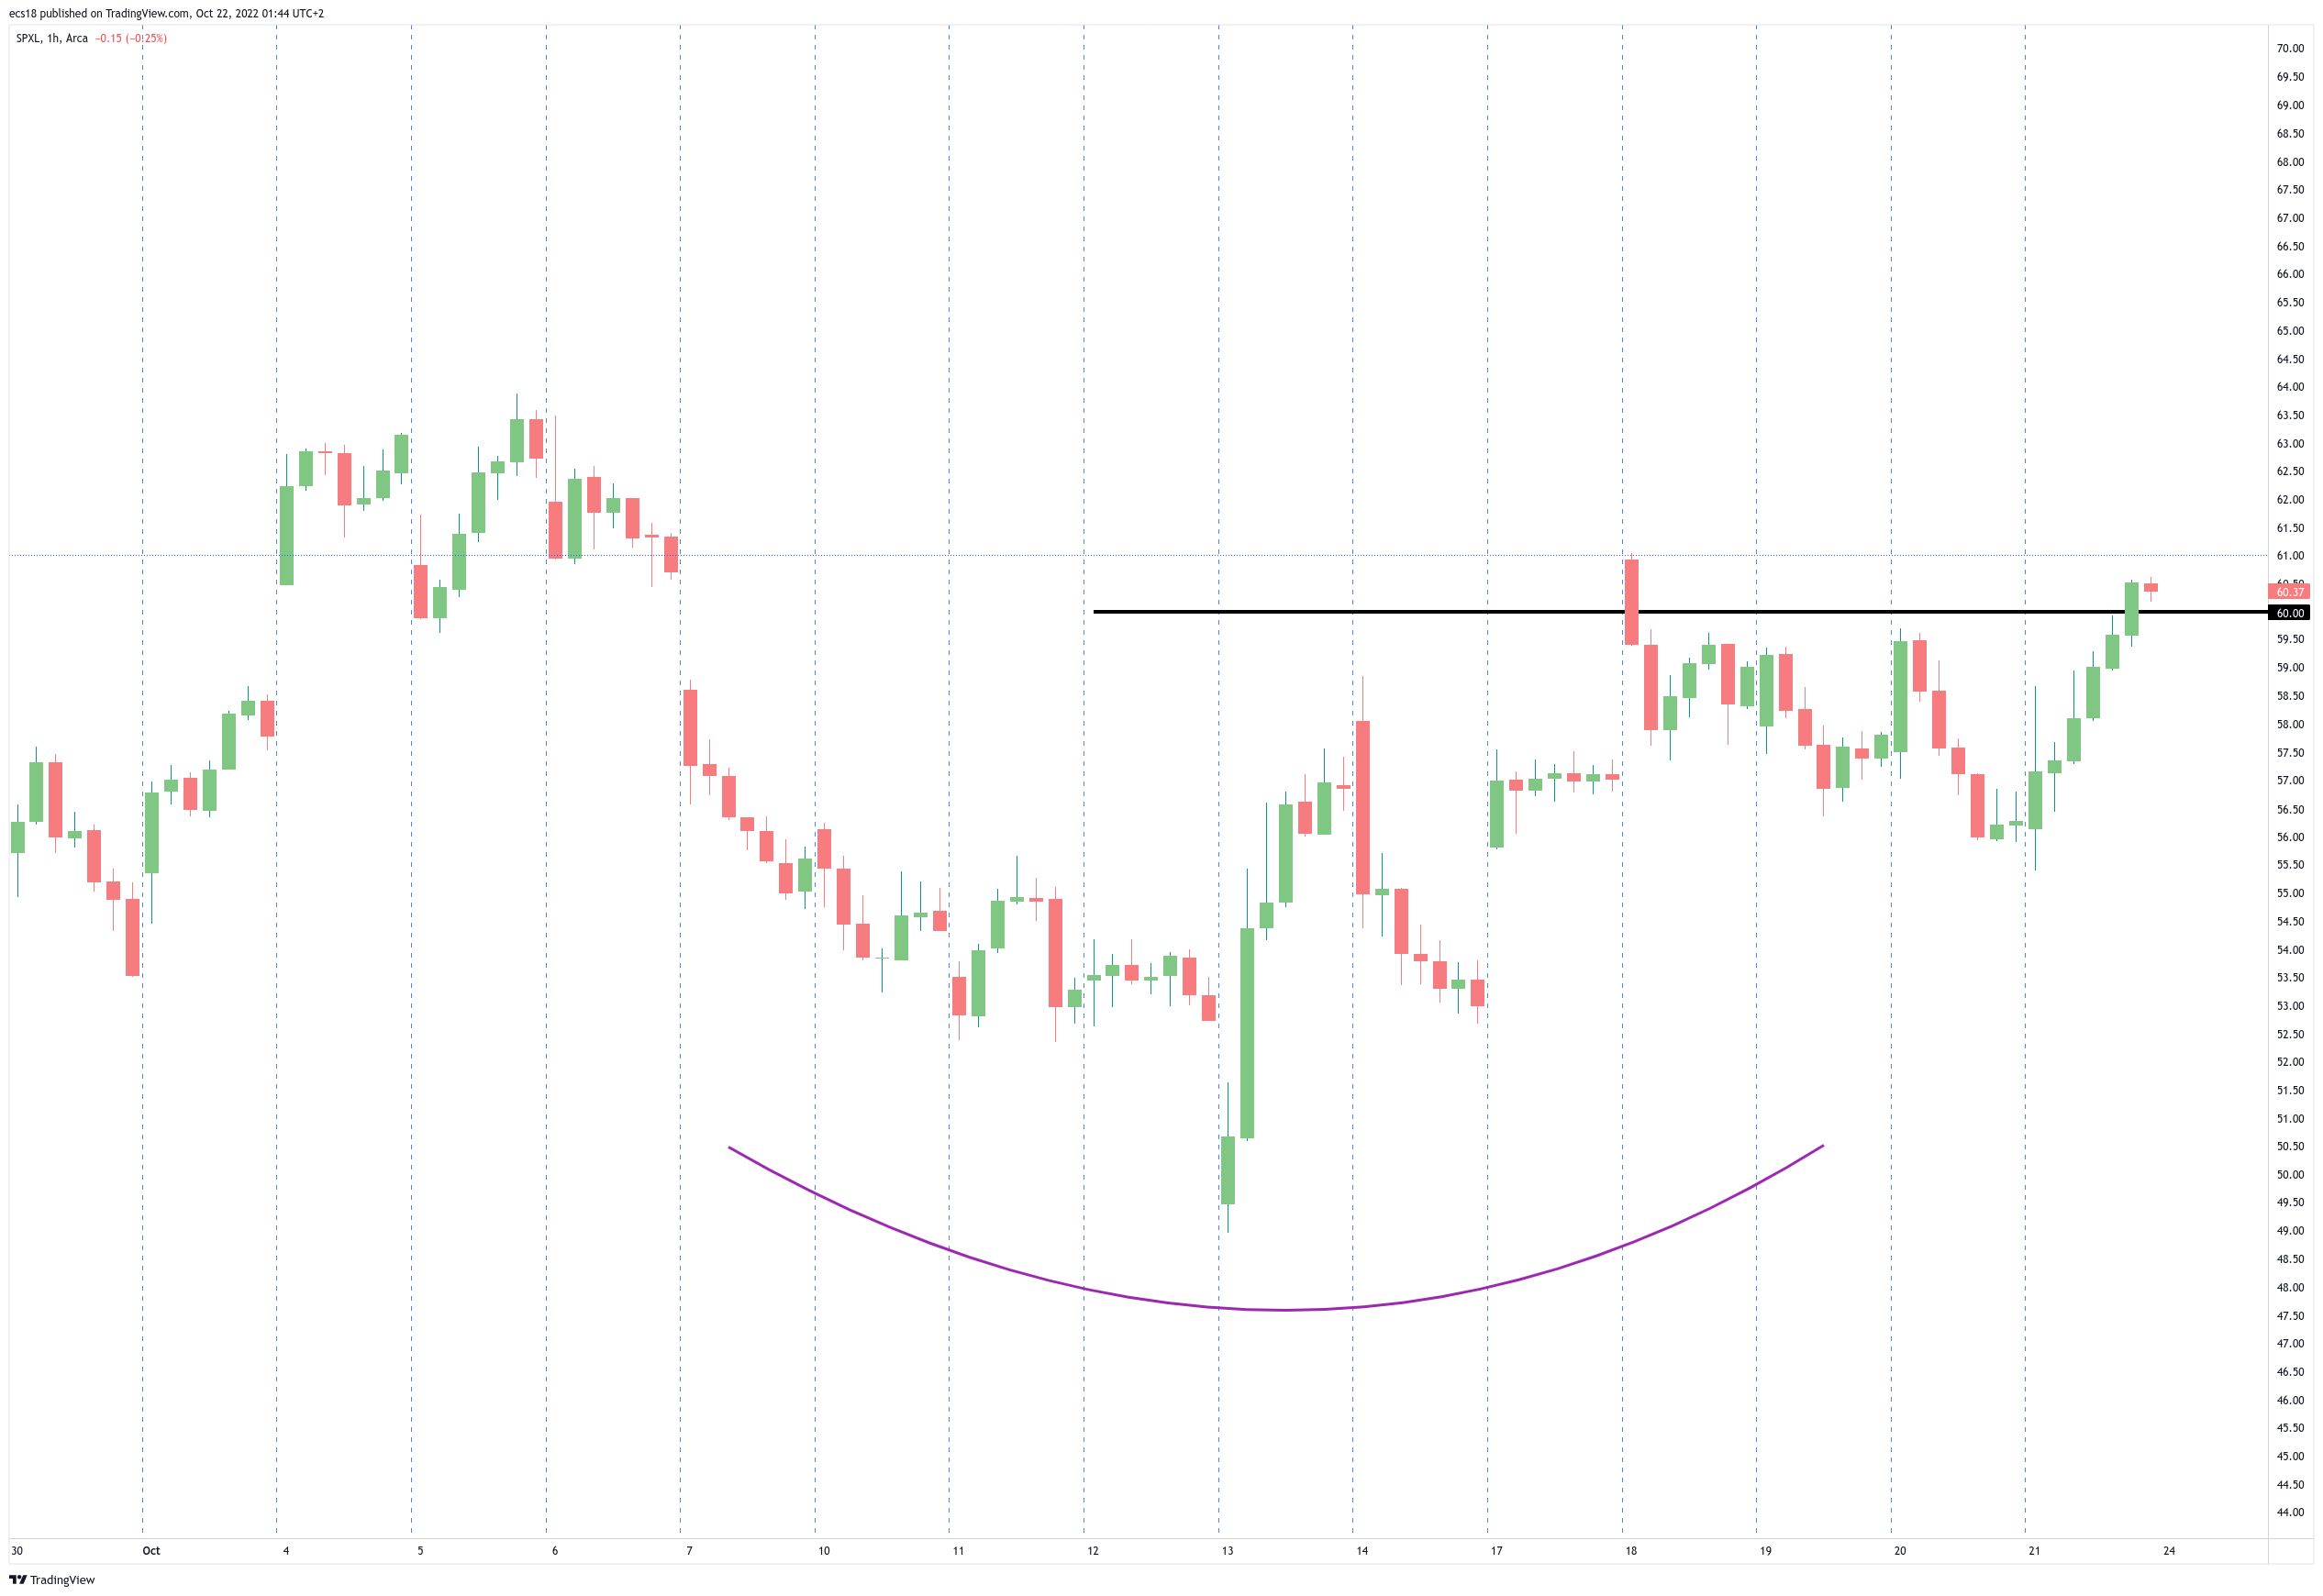
This is another quote from our weekend analysis:
The recent lows seem solid. This implies that we can start adding to the first allocation that we initiated on Tuesday. Ideally, we add two more allocations next week, on the dips, to scale up our allocation in a controlled way. We will try to buy the dip based on the levels that we retrieve from our algorithm (the same price points we release in our ‘daily Algo Alert’).
If we combine our volatility index readings with the information we retrieve from our algorithm we conclude that there is a really ‘juicy’ opportunity brewing in markets with a high probability of a bullish impulse that will materialize in the really short term.
Because this is happening at critical support on the daily chart we believe that markets will resolve higher and that an end of year rally is very likely.
Sign up to Trade Alerts and get full access to our algorithm’s buy/sell signals, ‘daily Algo Alert’ emails with highly accurate signal prices, detailed market analysis (weekends). Why not start auto-trading, we take away the headache for you and ensure your capital grows consistently over time, without your involvement while you remain in control of your account.


