The stock market in India is in great shape for almost 4 years now. Readers can verify the articles we wrote at the end of 2015 with a very bullish India stock market forecast. As in any secular bull market there is tactical bear markets, and, at a certain point, an end of the bull market. What to expect from India’s stock market going forward? The answer in the form of an outlook is here in our India stock market forecast for 2019. Arguably, this is more of an outlook rather than a forecast!
[Ed. note: This article about India’s stock market outlook for 2019 was originally published on September 28th, last year. Readers can verify this by checking the dates on the charts. Throughout 2019 we will frequently update our outlook for India’s stock market. The new updates will appear at the bottom of the current outlook. It allows our followers to track the evolution of India’s stock market as well as our outlook about India’s stock market. Last update of India’s stocks outlook: February 17th, 2019.]
The Nitfy 50 index (NIFTY) representing the largest 50 companies on the India stock market exchange rose from 7,000 points at the end of 2015 to 11,751 points in September of this year. That’s a 57% increase in 3 years. Is this a reason to sell, to take a wait-and-see mode for a while, or buy? The outcome of our India stock market forecast for 2019 should provide guidance to this question.
India stock market forecast 2019 vs. emerging markets forecast 2019
Before answering the questions outlined above we want to highlight that our India stock market forecast for 2019 is strongly influenced by intermarket dynamics. No surprise, there is a strong correlation with emerging markets (EEM), no surprise, as India is one of the largest markets.
As explained in great detail in our Emerging Markets Forecast For 2019 both the emerging market currencies (CEW) as well as the Euro are leading indicators.
Emerging market currencies have a chart with a similar setup as emerging stock markets: an amazing rise between Jan 2016 and Jan 2018, followed by a retracement. The recent retracement brought this instrument to an important support area. We wrote: “Readers should look at this chart as a heatmap which is divided in areas based on the bands of the channel. Emerging markets currencies went from support to resistance, and now remain in the upper band of their long term channel. Our interpretation? The bullish trend of emerging markets will continue in 2019 unless the Euro crashes in the next weeks or months.”
The Euro, and our interpretation of the Euro chart: “What we conclude after analyzing this chart in detail as well as the current global market landscape is the following. Both US and European stock markets are in ‘risk on’ mode, the US more than Europe. The Euro is not in a strong bullish nor bearish trend right now. Also, the peak of emerging markets in January of this year coincided with the Euro being stopped at its 2014 (crude oil crash) breakdown point with no other major ‘event’ in any global market. Since then, also on the Euro chart, no major trend up or down started.”
All in all we believe our India stock market forecast for 2019 is not negatively impacted by leading indicators of emerging markets. We will get worried if the Euro starts falling (sharply) as well as emerging market currencies.
India stock market forecast 2019 vs. 10-year Yields
This brings us to the underlying indicator: U.S. yields. As explained in How The US Dollar May Impact Emerging Markets In 2018 and 2019 we said that the primary driver, and early indicator, for emerging markets is U.S. yields. “With the strong correlations between the US Dollar vs emerging markets and commodities, it becomes clear that the most important market we are looking at is 10-year Treasury Yields (in the U.S.). Yes, this is, by far, the most important market in the world with the most important influences on a global scale. Bare with us as Yields are about to reveal future direction of the Dollar, emerging markets, US stocks, commodities, and precious metals any time soon!”
10-year Yields in the U.S. are at a major turning point, that’s what we wrote in End Of 40-Year Bull Market In Bonds. They are trying to end their 40-year falling trend. This, of course, is breaking news, regardless whether mainstream media talk about it or not.
If, and that’s a big IF, Yields will continue to rise, it will put pressure on the U.S. Dollar, and favor emerging market currencies as well as the Euro. This, for us, is one of the important indicators for our India stock market forecast for 2019 and beyond.
India stock market forecast: news is the lagging indicator
We have said it many times before: news is the lagging indicator.
Investors tend to search for news as they want to understand the India stock market forecast, similar to any other market forecast.
Believe it or not, most investors get trapped by information overload. They read and keep on reading until they get rely solely on information and news. As per Tsaklanos his 1/99 Investing Principles, just 1% of the news is relevant to investors.
If we go back to our previous India stock market forecast (last year) we find some interesting news articles.
This is just one of the financial news updates from a year ago: “As Indian equities are set to close out 2017 near all-time highs—and volatility hovers near historic lows—analysts say investors must keep an eye on politics for signs of a turn in the current bullish sentiment.”
We also found this Economic Times of India article suggesting that India’s stock market would overtake Toronto, something that has not happened since 2008: “Since then, India’s market swelled by $800 billion as investors flocked to a nation where the government boosted consumption through a job-guarantee plan, streamlined the indirect-tax system and opened more industries to foreigners. ”
Now, one year later, with the Nifty 50 index trading 1,500 points higher (some 15%) we can clearly see that news tends to be lagging indicator. Stay away from 99% of the news, for any market forecast.
India forecasts: economic indicators in 2019
Any forecast should have a fundamental component, though we do not consider fundamentals as leading indicators. News is a lagging indicator, fundamentals are supporting indicators, a small number of charts are leading indicators.
Some of the important fundamental growth measures in India, according to TradingEconomics, are outlined below.
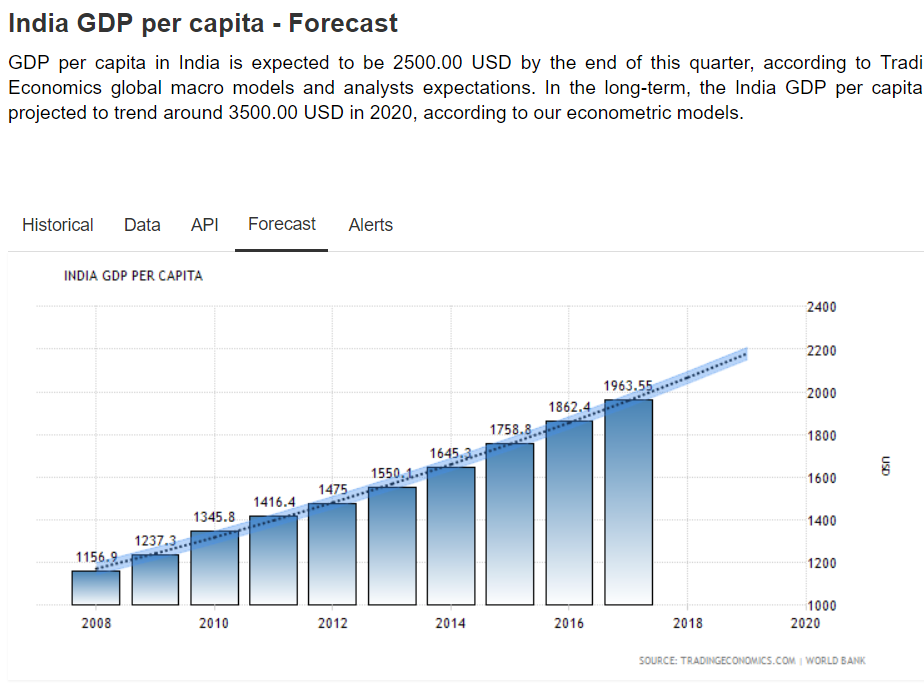
First, is a strongly rising inflation rate is bullish for its stock market. India’s inflation rate is declining right now. Typically, it rises in the first half of the year.
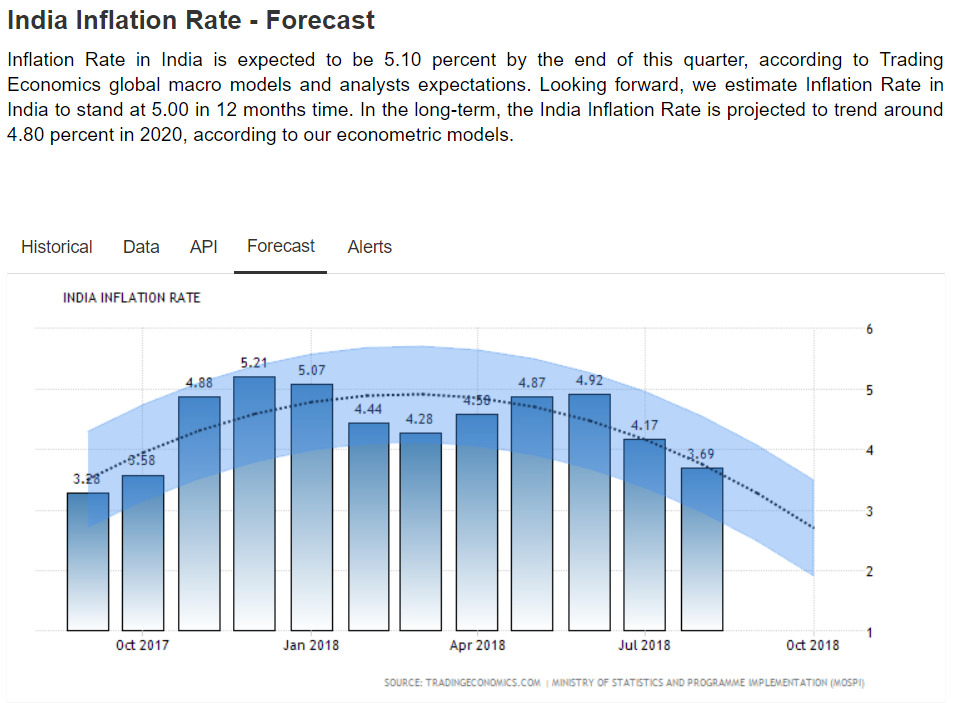
The forecasted economic indicators for 2019 look much better. As seen on below table, inflation rate, as well as most other economic indicators, tend to stabilize in Q3, only to go up sharply in Q1n and Q2. That’s what we see for 2019 as well.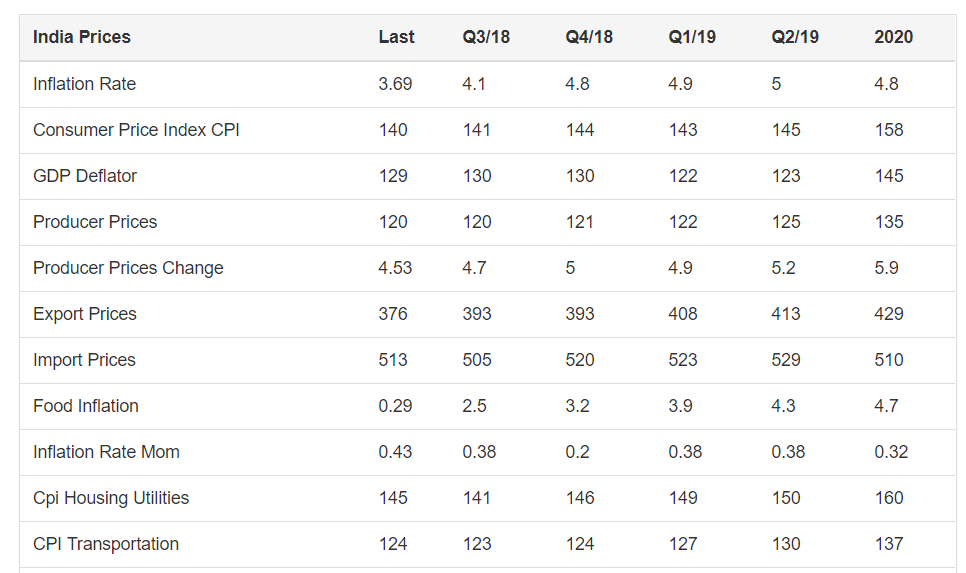
The GDP per capita is in a rising trend, as per this GDP per capita forecast at TradingEconomics.
India stock market forecast: the chart going into 2019
Given the economic fundamental data points and leading indicators outlined above we sense that India’s stock market is now at a decision point. That is visible on its chart as well.
Leading indicators support a bullish India stock market forecast for 2019 while economic data show a classic slowdown in the last months of the year. Provided economic data improve, as per the forecasted figures above, we will see this reflected on India’s stock market chart.
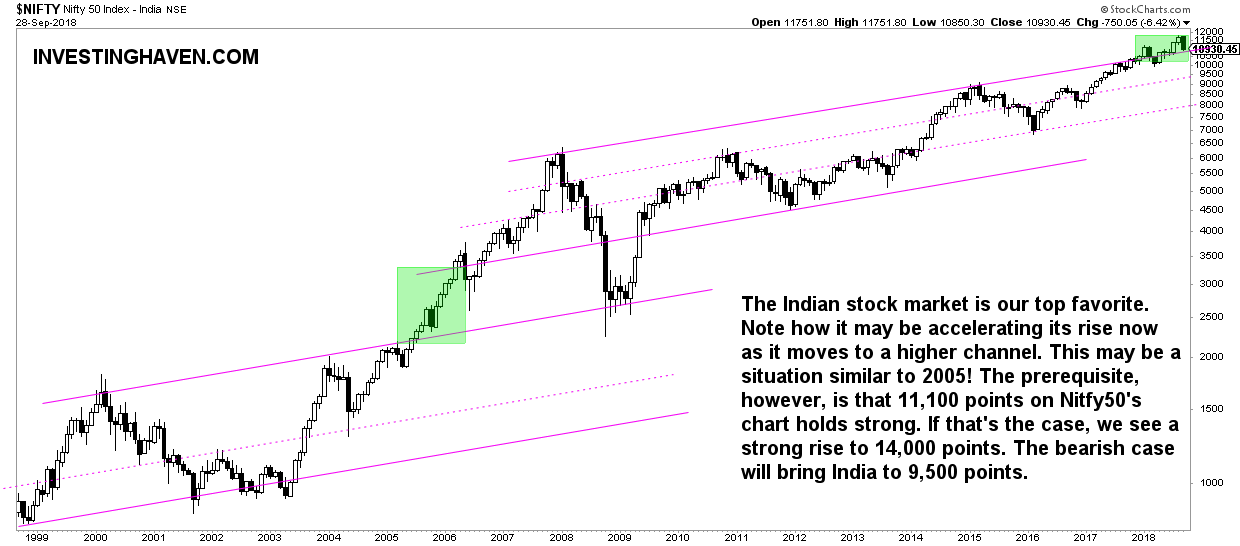
As explained in our 4 Top Emerging Markets in 2019 the long term chart of India tries to move from the current rising channel to a higher one (not created yet on the chart). That’s the key in forecasting: try to identify a point where a market is heading towards.
This is what we wrote recently:
We strongly sense that India will accelerate its rise. If that’s what is happening right now we will see a similar move as the one in 2005 where India moved to a higher level channel.
So, in sum, if economic data and leading indicators continue to favor India’s stock market, and Nifty 50 continues to trade above 10,800 points, it will likely accelerate its rise. In this case we will see 15,000 points in India’s stock market in 2019.
If 10,800 points cannot provide support we see a decline between 8,500 and 9,500 points, where a strong bottom will act as support. We anticipate a rise back to 11,000 points in 2019 in that scenario.
In other words, the line in the sand for our India stock market forecast for 2019 is 10,800 points in the Nifty 50 index, combined with its 2 leading indicators and economic indicators.
** Update on January 5th, 2019 **
How is our India stock market forecast for 2019 playing out as 2019 kicks off?
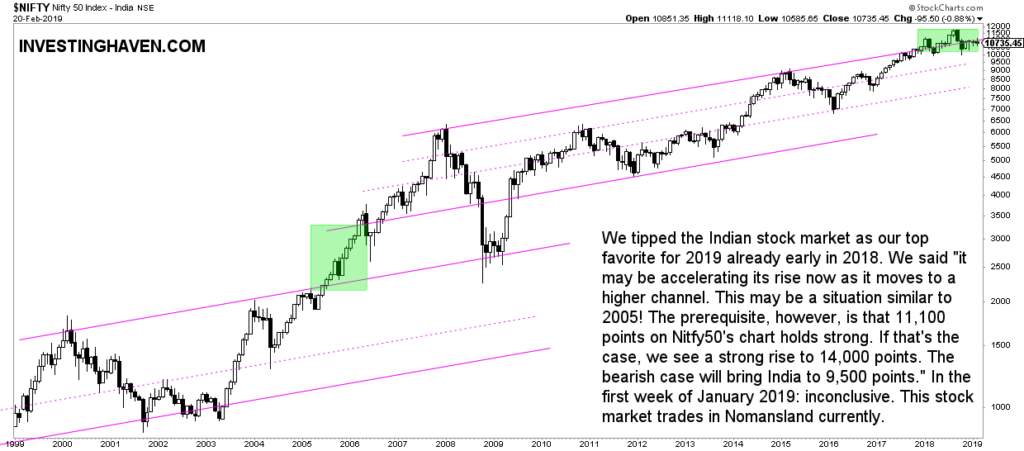
The first chart which represents the Nifty 50, top 50 companies in India, helps understand the points made above.
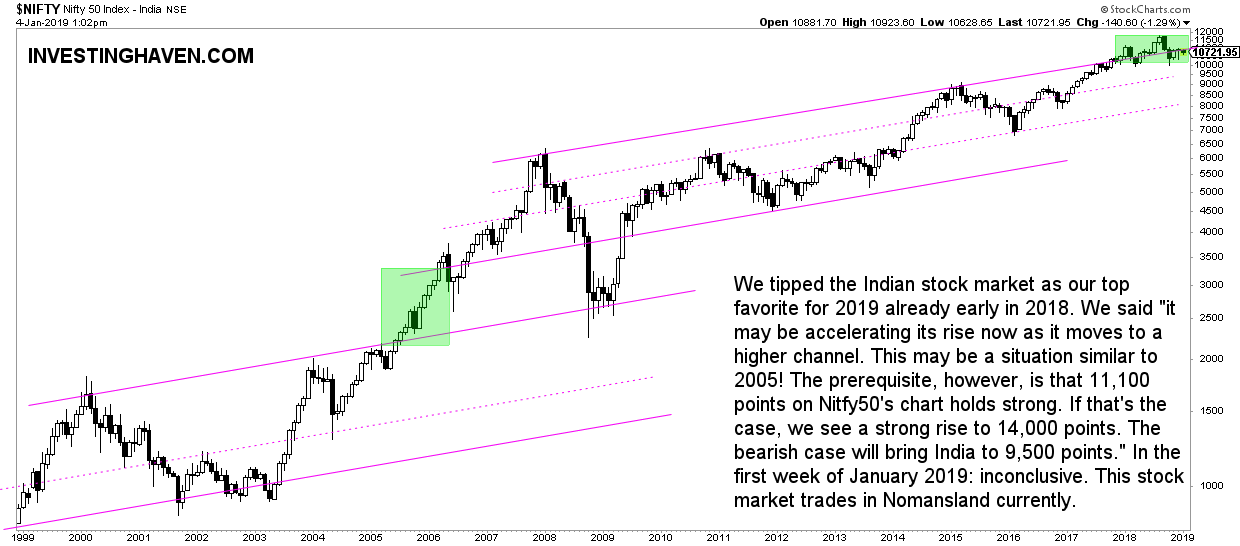
The key finding about Indian stocks is that if and once it starts rallying it would rise to a higher channel. “This may be a situation similar to 2005! The prerequisite, however, is that 11,100 points on Nitfy50’s chart holds strong. If that’s the case, we see a strong rise to 14,000 points.”
India Stock Market: More Evidence of Decision Point in 2019
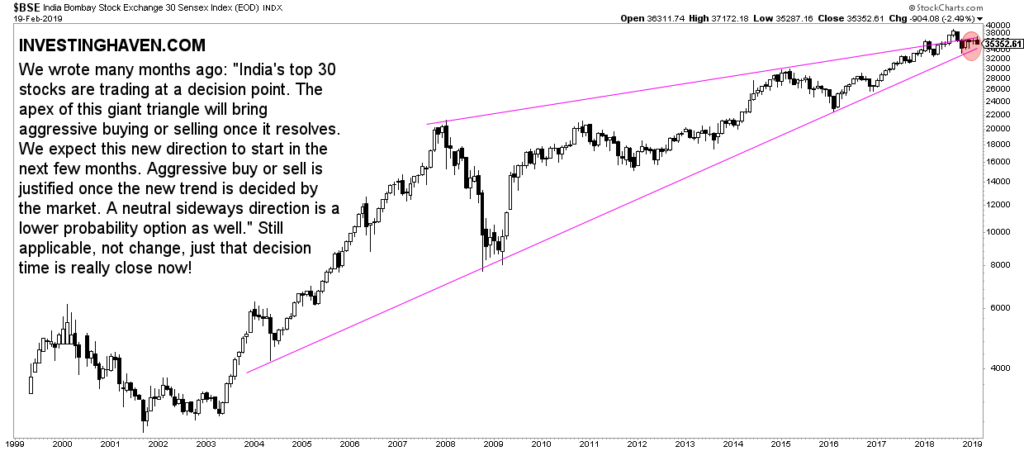
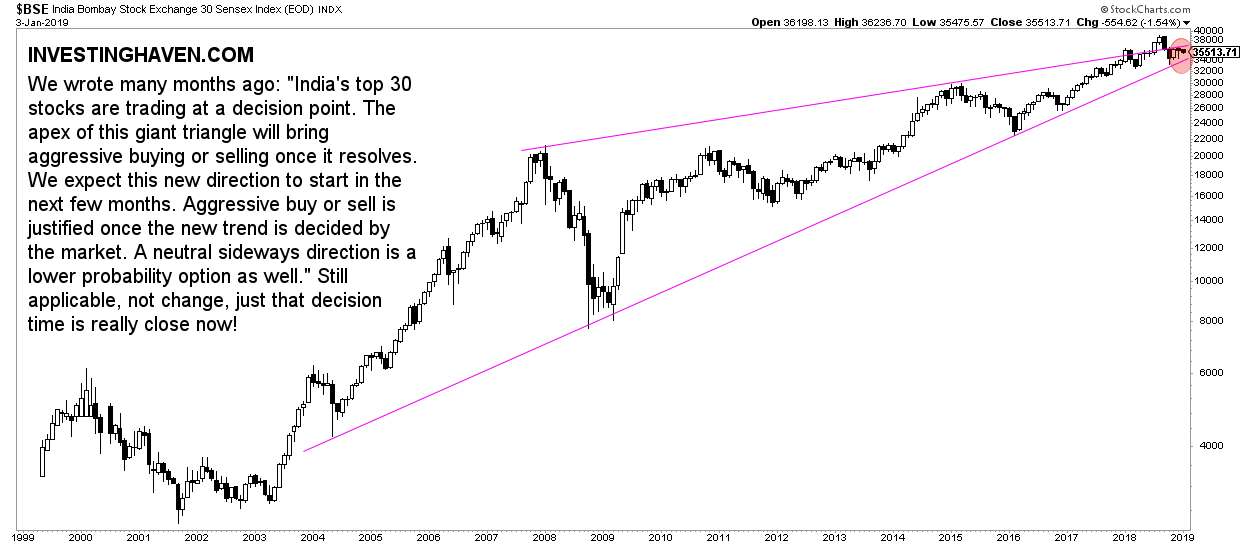
There is this other key index for the Indian stock market: the Bombay 30 index.
We wrote many months ago: “India’s top 30 stocks are trading at a decision point. The apex of this giant triangle will bring aggressive buying or selling once it resolves. We expect this new direction to start in the next few months. Aggressive buy or sell is justified once the new trend is decided by the market. A neutral sideways direction is a lower probability option as well.”
Below is the chart of the Bombay 30 index. It makes our point. The conclusions from back then are still applicable other than decision time is really close now!
What this second chart adds in terms of value is that it shows even more how important this make-or-break level is. The giant triangle in this specific form will have major implications once it breaks out or break down.
It is a matter of time until a trend starts in the Indian stock market.
** Update on February 17th, 2019 **
India stock market outlook in Feb 2019: indecisive
If there is one thing that characterizes India’s stock market right now, at least on their charts, it really is indecisiveness.
Let’s review both indexes which we also discussed above, in our original outlook.
First, the Nifty 50 index.
Essentially, the Nitfy 50 index has gone nowhere in recent months. This is the evolution any reader can track by comparing prices outlined in above charts over time:
- Sept 28, 2018: 10930 points
- Jan 4, 2019: 10720 points
- Feb 20th, 2019: 10735 points
The stock market in India is in Nomansland. Literally.
Our outlook on India’s stock market really depends on what happens around current price levels. The monthly chart pattern which is the dominant trend of India’s stock market is flat currently. As soon as it breaks down or breaks out we will be able to get out of the indecisive outlook we currently hold.
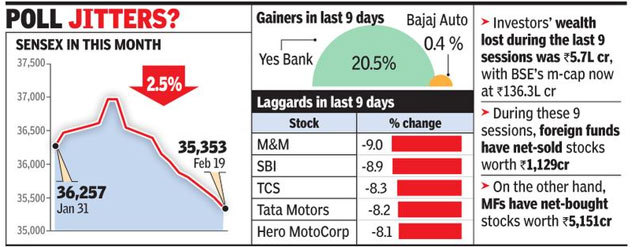
Interestingly, India Times reports that anothere index, the Bombay Stock Exchange 30 sensex index, has recorded its longest losing streak in over 8 years.
With this poll it summarizes the gainers and laggards in February of 2019. Unfortunately we cannot derive any meaningful conclusion with regard to our India stock outlook!
Similarly, the monthly chart of the Bombay Stock Exchange 30 sensex index does not reveal any new trend or trend change in its long term dominant pattern. We see exactly the same set up as in January and last September!
The same conclusion comes to mind when it comes to India’s stock outlook: indecisiveness.
Until further notice we do not see any other outlook for India’s stock market!