There are charts, and then are gorgeous charts. One of the most gorgeous charts are to be found in the emerging markets space especially because emerging markets started a new secular bull market, the type of bull market you don’t want to miss. That’s why forecast that Emerging Markets Will Be Our Top Play In 2020. One other gorgeous chart, maybe not as powerful as the emerging markets one but certainly a must-see for every investor is the long term Nasdaq chart. No surprise of course but we see that many investors tend to ‘forget’ about those obvious easy-to-score winners. This Nasdaq chart should remind investors of the obvious things: go for this long term momentum uptrend.
Sometimes it takes a while until you get the chart ‘right’. There is no magic formula in terms of settings that fits all charts. Adjusting until it ‘works’ is the daily job of chartists.
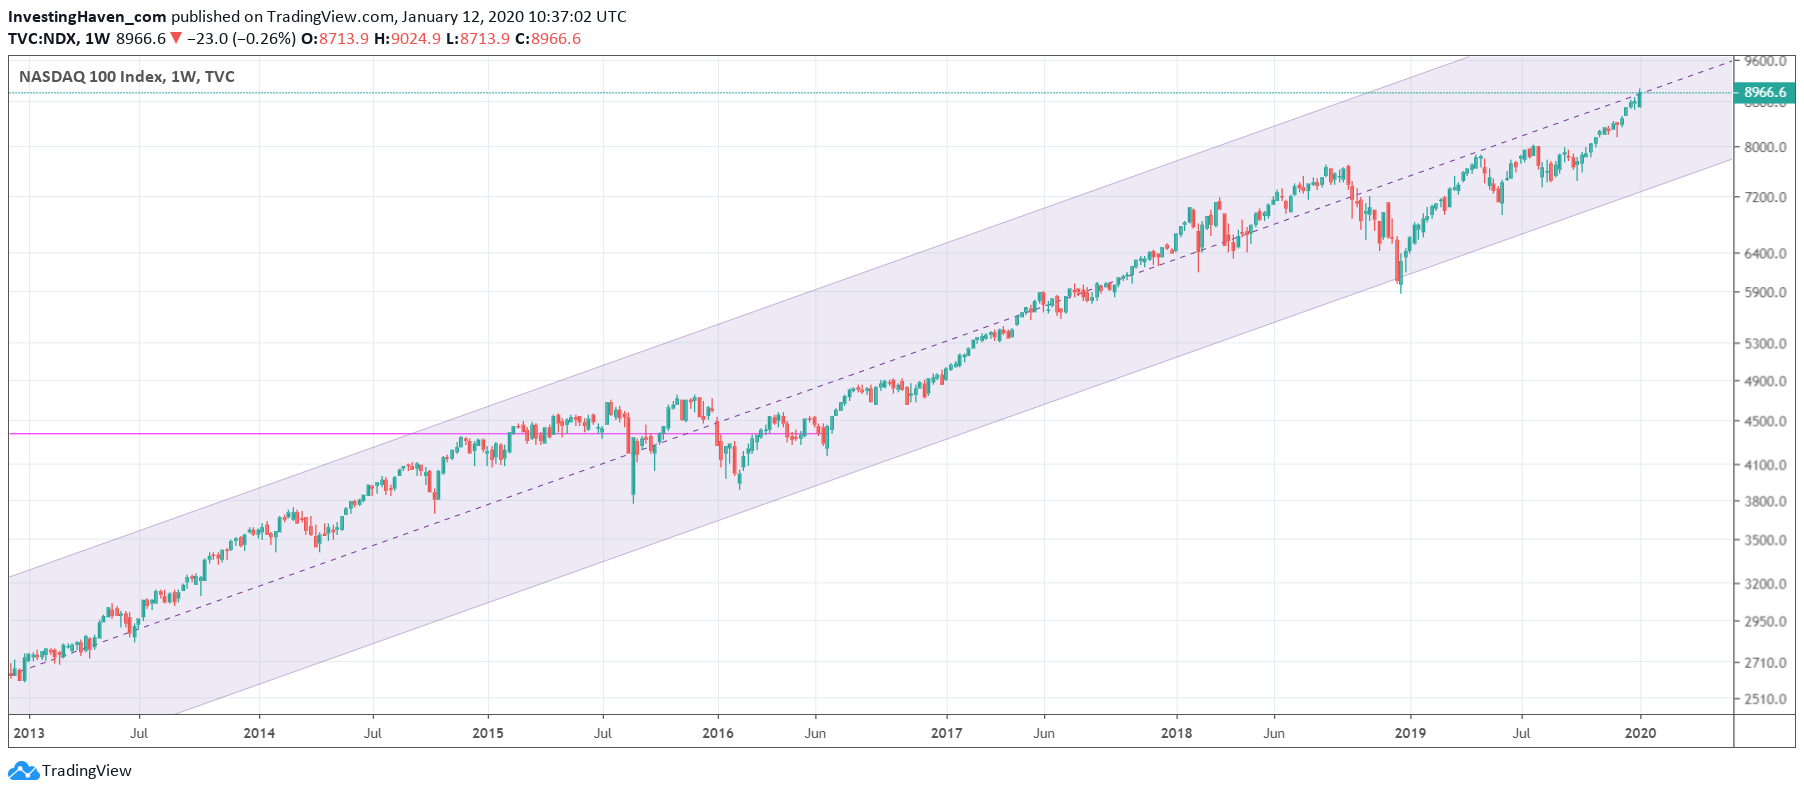
This Nasdaq chart embedded below is the type of chart that does not require a lot of effort to set up. Playing with the monthly and weekly timeframes until you see the dominant trends, and that one special figure which was 4000 points.
The one thing that stands out is this powerful rising channel that is not violated for 6 straight years. It is clear that our bullish stocks forecast is going to extend this trend for another 2 years.
No coincidence, a few subsectors in the Nasdaq are looking extremely powerful for 2020 and 2021, first and foremost semis and biotech (sources: The 6 Best Sectors For Investing In 2020 as well as Top Biotechnology Stocks Forecast For 2020).
Investors basically have 2 simple choices after realizing the potential of the Nasdaq based on below chart.
The first option is to play the index, relax for some 18 months and then look for an exit point as we move into a new ‘risk off’ cycle as per our Stock Market Crash 2022 Prediction.
The second option is to pick a few sectors and the most promising stocks in there. This requires more effort, and certainly does not happen by reading financial media. Great chart analysis skills combined with basic balance sheet analysis are required for this.
If anything investors should not be distracted by the news. It always will be gloom and doom, because that’s what sells well. If you listen to the news you might even not consider tech stocks. Just this one chart shown below invalidates all clueless news items that go against this powerful new stock bull market.
At InvestingHaven we ignore news because its a lagging indicator. We have a set of leading indicators, and they suggest a stock bull market is on. That’s why our Momentum Investing portfolio has 3 tech stocks, really no coincidence here and certainly no surprise. We play 3 to 6 month cycles, and they look great for tech stocks right now. Moreover, in our Trade Alerts we play the S&P 500 moves on a shorter timeframe. In 2019 we realized 301% profits with the S&P 500 trades. Both are what-are-you-waiting for trades.