
At InvestingHaven we apply an in-house stock market forecasting cycle. It is based on the combination of where 10-year Treasury rates trade in their long term chart pattern as well as the Russell 2000. Both combined determine when a trend changes from ‘risk on’ to ‘risk off’ and vice versa. Currently it is crystal clear that both 10-year Treasury rates as well as the Russell 2000 are completing their 18 to 20 month ‘risk off’ cycle, and about to start a new ‘risk on’ cycle. This means that this stock market forecasting cycle predicts a bull market for 2020. This is one of the most crucial 2020 forecasts from InvestingHaven’s research team.
Readers know by now that we have a very disciplined approach to investing as well as analyzing markets. Moreover, a thorough method is required to understand where markets are going, and be successful in forecasting. It is this disciplined approach we apply in our stock market forecasting cycle model. What comes out of this with a high level of reliability is a stock bull market in 2020.
We are on record with our bullish stock market forecast for 2020. And this is in line with our Dow Jones Forecast Of 32,000 Points For 2020 And 2021 published a few days ago.
How to forecast a stock market bullish trend
As per our 100 investing tips:
The secret about forecasting U.S. stock markets and turning points is to properly use 3 charts and leading indicators. First, on the highest level and longest timeframe, the 10 year Yields determine the multi-quarter risk on / risk off direction of stock markets as they move from top to bottom in rising or falling channels. Second, on a multi-year timeframe, the Russell 2000 to S&P 500 ratio determines the turning points based on breakout and breakdown patterns. Third, on an intra-year basis, the Russell 2000 to 10 year Yields ratio determines the turning points based on breakout and breakdown patterns.
All indicators in our stock market forecasting model are on green right now a few months before 2020 kicks in.
Now is a time to buy stocks for 2020.
However, there will be a time to sell stocks as well, don’t forget this. When exactly? As soon as the Dow Jones Historical Chart On 100 Years hits the top of its 100 year channel!
‘Small’ detail: we do NOT use any news as a source in forecasting stock markets nor any other market. News articles are lagging indicators, not leading indicators. Readers can verify this themselves by looking here and here.
Why our stock market forecasting cycle is bullish going into 2020
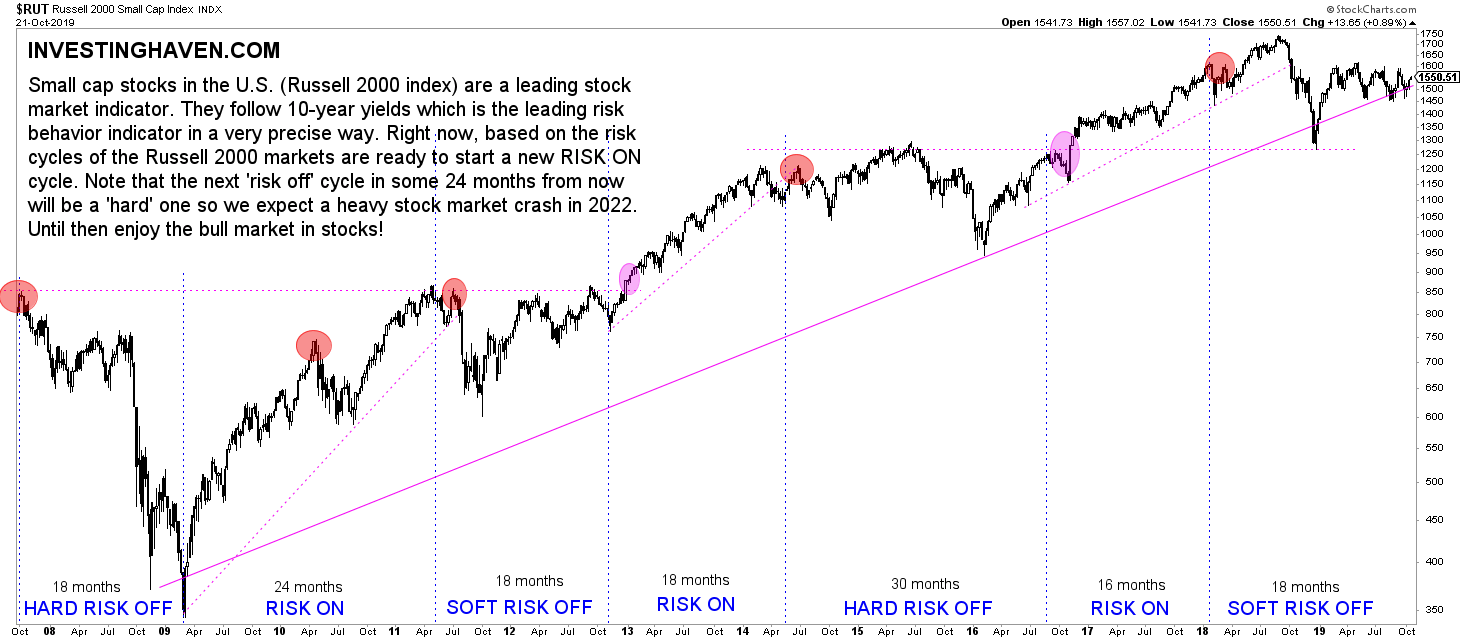
Essentially, it is the Russell 2000 index that has the clearest set up. It helps tremendously in understanding the stock market forecasting cycle.
Obviously the cycle goes from ‘risk on’ to ‘risk off’. The trick to recognize when this trend change takes place is by reading its chart both horizontally as well as in a diagonal way. The Russell 2000 has a track record in testing horizontal resistance, and breaking down as well as breaking out. It’s the nature of this index.
Every time a horizontal resistance is broken to the upside we tend to see the start of a new ‘risk on’ cycle especially if it is combined with 10-year Treasury rates bottoming.
This will be a global bull market based on the stock market forecasting cycle
We looked at multiple markets to try to understand where and whether our stock market forecasting model applies.
Good news, we strongly believe this will be a global stock bull market in 2020!
Just two examples from recent weeks that confirmed this same outcome:
Our Bullish Emerging Markets Outlook For 2020 And 2021
China Stock Market Outlook For 2020 And 2021 has a Bullish Bias
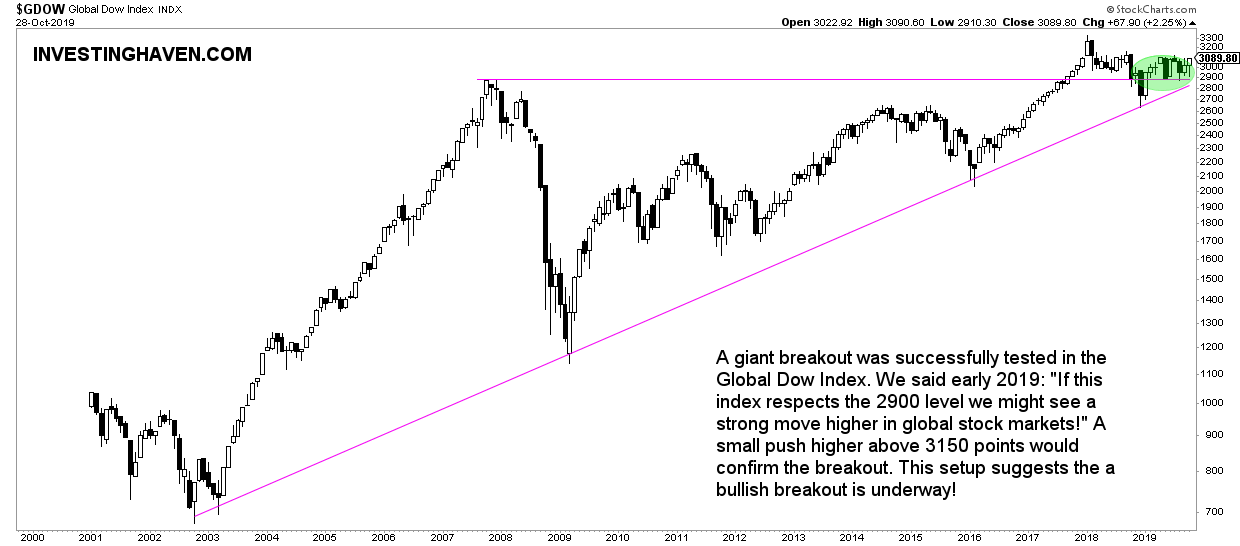
This is also confirmed by looking at the Global Dow Index (GDOW). Below is the monthly chart on 20 years of the GDOW. This is a beautiful setup, not seen in many years. It is not our leading indicator in our stock market forecasting model but more of a secondary (supporting) indicator.
First, we see this breakout attempt from 2017 which in the end failed.
Second, the backtest was successful. It resulted in this 2 decade long rising support line to be tested.
Third, right now we see this bullish setup with higher lows in the last 12 months.
Which stocks do we forecast to be bullish in 2020
This is the million dollar question.
In order to be successful in leveraging the profit potential from our stock market forecasting model it is imperative to choose the right stocks.
According to CNBC it is this list of stocks that will do well, and they add this comment to it.
CNBC screened the largest 50 companies in the S&P 500 and found which stocks have the most upside to their consensus 12-month price target set by analysts on Wall Street. In other words, these are the big U.S. stocks analysts believe will be up the most in the next one year.
We would argue small cap stocks are the place to be in 2020.
We are continuously on the lookout for great small and mid cap stocks. We publish the best tips we can find in our free newsletter, and even offer this as premium content for free. Become a member now of our Free Newsletter: Get Access To Premium Content >>


