The chopiness in stock markets continued last week, after a few bullish days the week before. That’s what happens in a consolidation: a few days up, everyone gets excited and gets in just too late only to find themselves in front of a series of down days. We are still on track for a bullish outcome, in line with our bullish Dow Jones forecast for 2021. As we prepare our new market forecast for 2021 (yes we are working on our annual market forecasts during this time of the year) we start seeing strong signs of the end of the once in a decade, even once in a century, type of extreme volatility. Shorter term, though, we may expect continued volatility. Very short term, we have to closely watch the resolution of this pretty special setup in the S&P 500.
The chart below comes from our Trade Alerts service, a short term portfolio that tracks our buy and sell signals in the S&P 500. Year to date, this portfolio delivered +98% profits.
You read this correctly, our portfolio is up 98% and we did so with the highest level of protection and risk management. Since March of this year, all our trades were partial allocations (against the total short term portfolio). That’s the only sane and safe way to protect capital (which is by all means our trading rule #1), while still maximizing profits (which is why we have a smart algorithm and augmented it with disciplined trading rules).
Every weekend we send an educational update with relevant insights for traders. This update features deep insights from leading charts from our research team. We often feature our crash indicators, like VIX, with deep insights from those charts. The S&P 500 chart below is one of them, and the annotations are the ones we analyze in great detail. That’s the guidance we give on top of our very successful buy/sell signals.
That said, we share this chart, exceptionally, in the public domain, as a teaser of the materials our premium members receive.
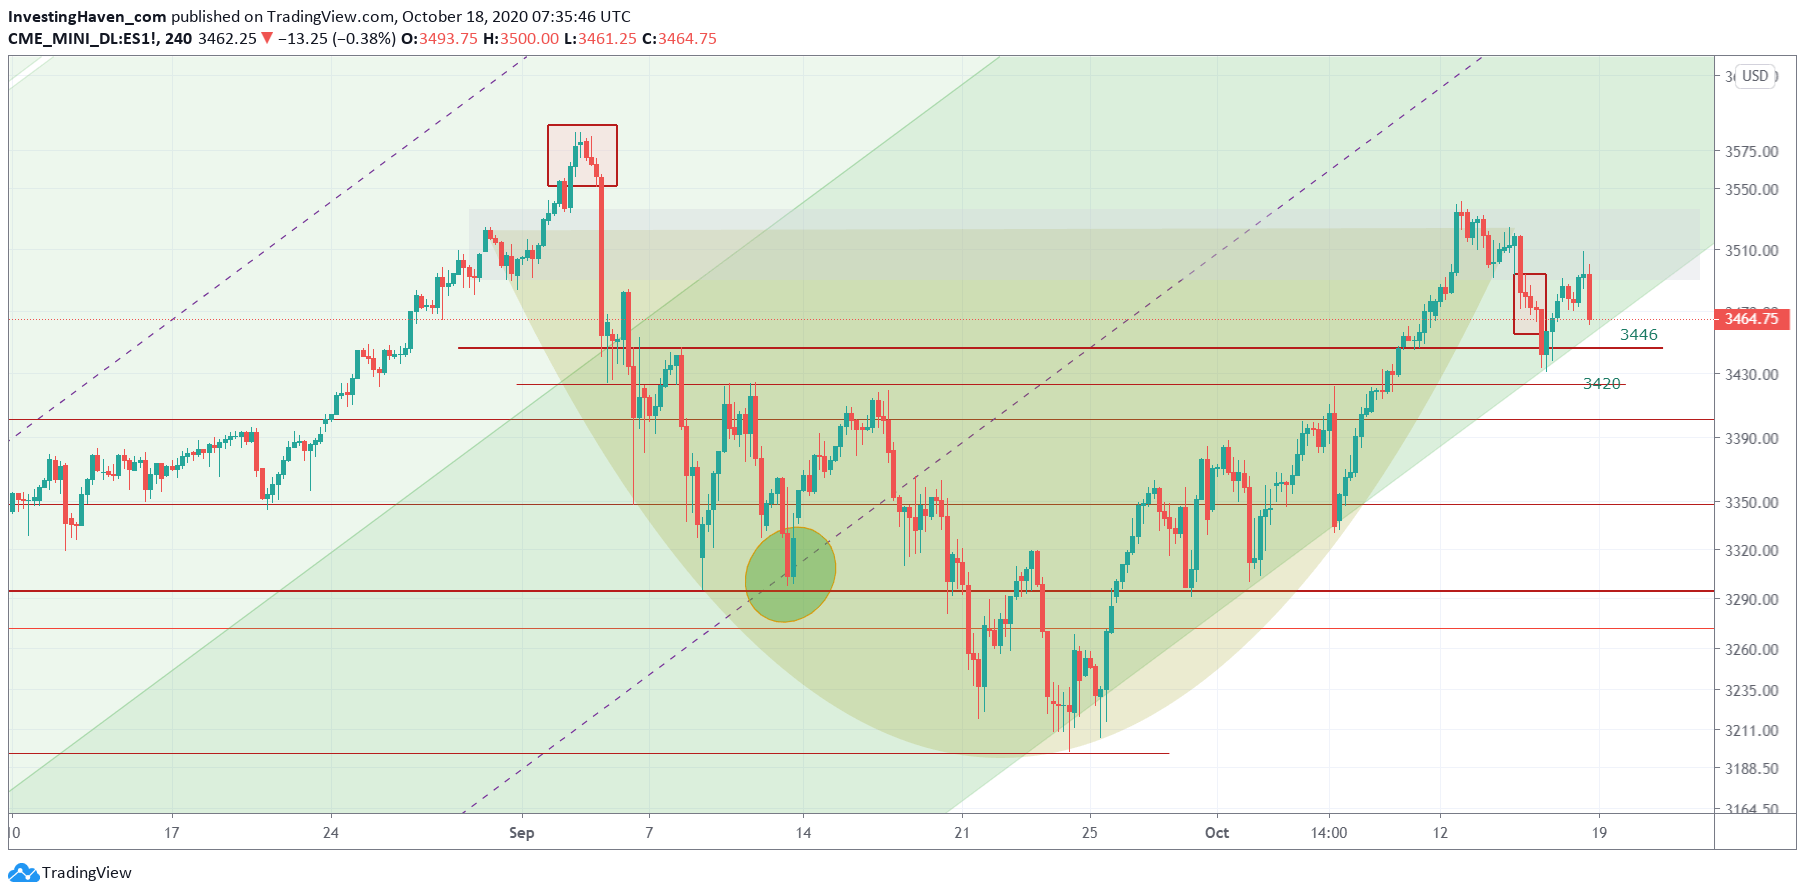
The way to read this 4h S&P 500 futures chart is very simple:
- A bullish reversal is complete, and it took the S&P 500 some 6 weeks to work its way through a bullish outcome.
- The uptrend was tested several times, especially since September 24th.
- On Friday, after market, we saw another attempt to test the uptrend.
- Whatever happens on Monday or Tuesday will be crucial. This uptrend may hold or it might not hold.
If the uptrend holds, great, we can be sure that all time highs in the S&P 500 will be tested before US elections.
However, if the uptrend does not hold, we have to carefullywatch 3390 and then 3350 points. They will act as support for the longer term uptrend. In that scenario we might see a sideways trend until there is news about new stimulus and/or a vaccination breakthrough.
This short term analysis is relevent for short term oriented traders, but also for medium and long term oriented investors. That’s because as per Tsaklanos his 1/99 Investing Principles it is just 1% of price points that determine the market’s direction.
Better pay attention to these few price points, particularly for positions that are short and medium term oriented.
Enjoying our work? We invest in broad stocks in our Momentum Investing portfolio. Also our Trade Alerts premium service plays the S&P 500 in ways that exceed everyone’s expectation with a year to date realized profit of +98%. So far, this year, our combined portfolio is delivering +70% year to date. We are on track to double our capital in 2020, as per our Mission 2026.