
The absolute number #1 stock chart to track is … the Russell 2000. Really? The entire world is looking and talking about the Dow Jones, S&P 500, S&P 400, and whatever else have you. We don’t care over here at InvestingHaven, our methods are rock solid and we stick to our practices that have stood the test of time. The ultimate indicator for stock market investors is the Russell 2000. Guess what, as per our forecast made a year ago and documented in our Dow Jones Forecast stocks are bullish. And the Russell 2000 is now confirming this. We expect a nice end of year rally as we are preparing our 2021 market forecasts.
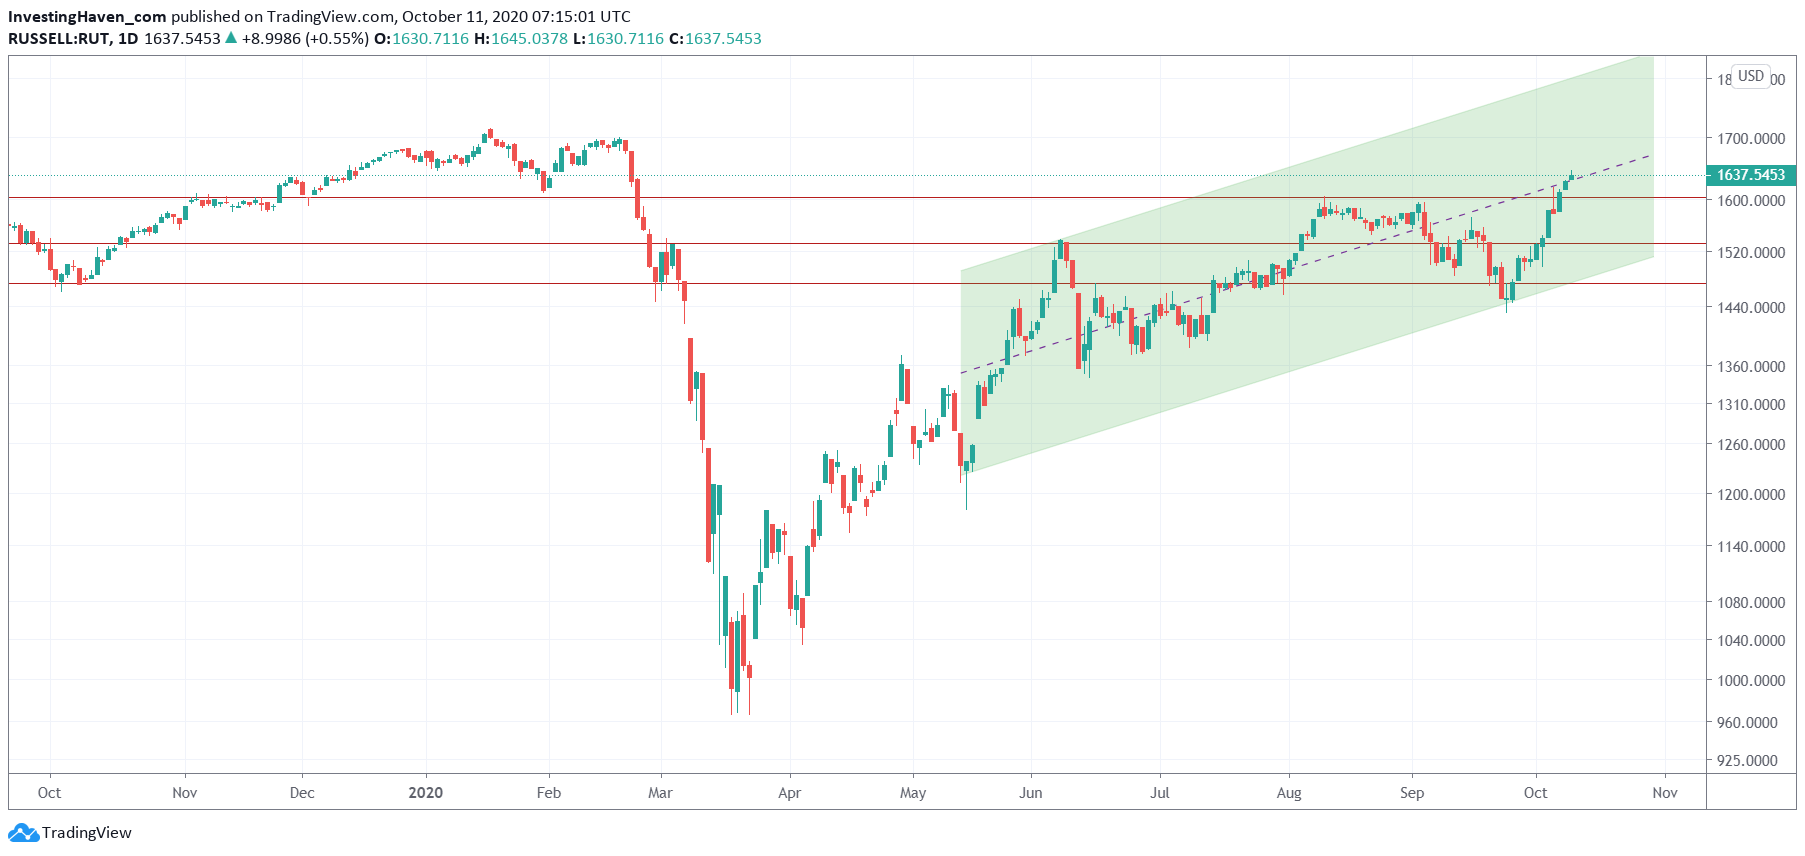
Let’s start with the daily chart.
Pretty impressive uptrend since May, isn’t it?
Admittedly, pretty rough. A choppy uptrend, with some good sell offs, particularly the one end of September.
But overall the trend is clearly up.
Is this the one and only observation: a good uptrend?
No, there is a much (MUCH) more important conclusion from the Russell 2000. And we did on purpose start with the daily chart, even though the key observation does not come from the daily.
As per our 100 Investing Tips For Long Term Investors charting requires a TOP DOWN approach. We always MUST start with the higher timeframe (monthly and weekly) after which we look at the daily.
Yes, we did this on purpose, to remind you of this important principle.
The daily chart above may show a choppy uptrend, and let you focus on the recent volatility and sell off from a weeks ago.
However, this week’s recovery from the end of September sell off is not the key thing.
The key take away is that this week’s rise is a secular breakout!
Below is the pattern that we created 1 year ago! We did not touch it since then. Guess what, this week’s rise was breakout above this 5 year ‘consolidation-alike’ pattern.
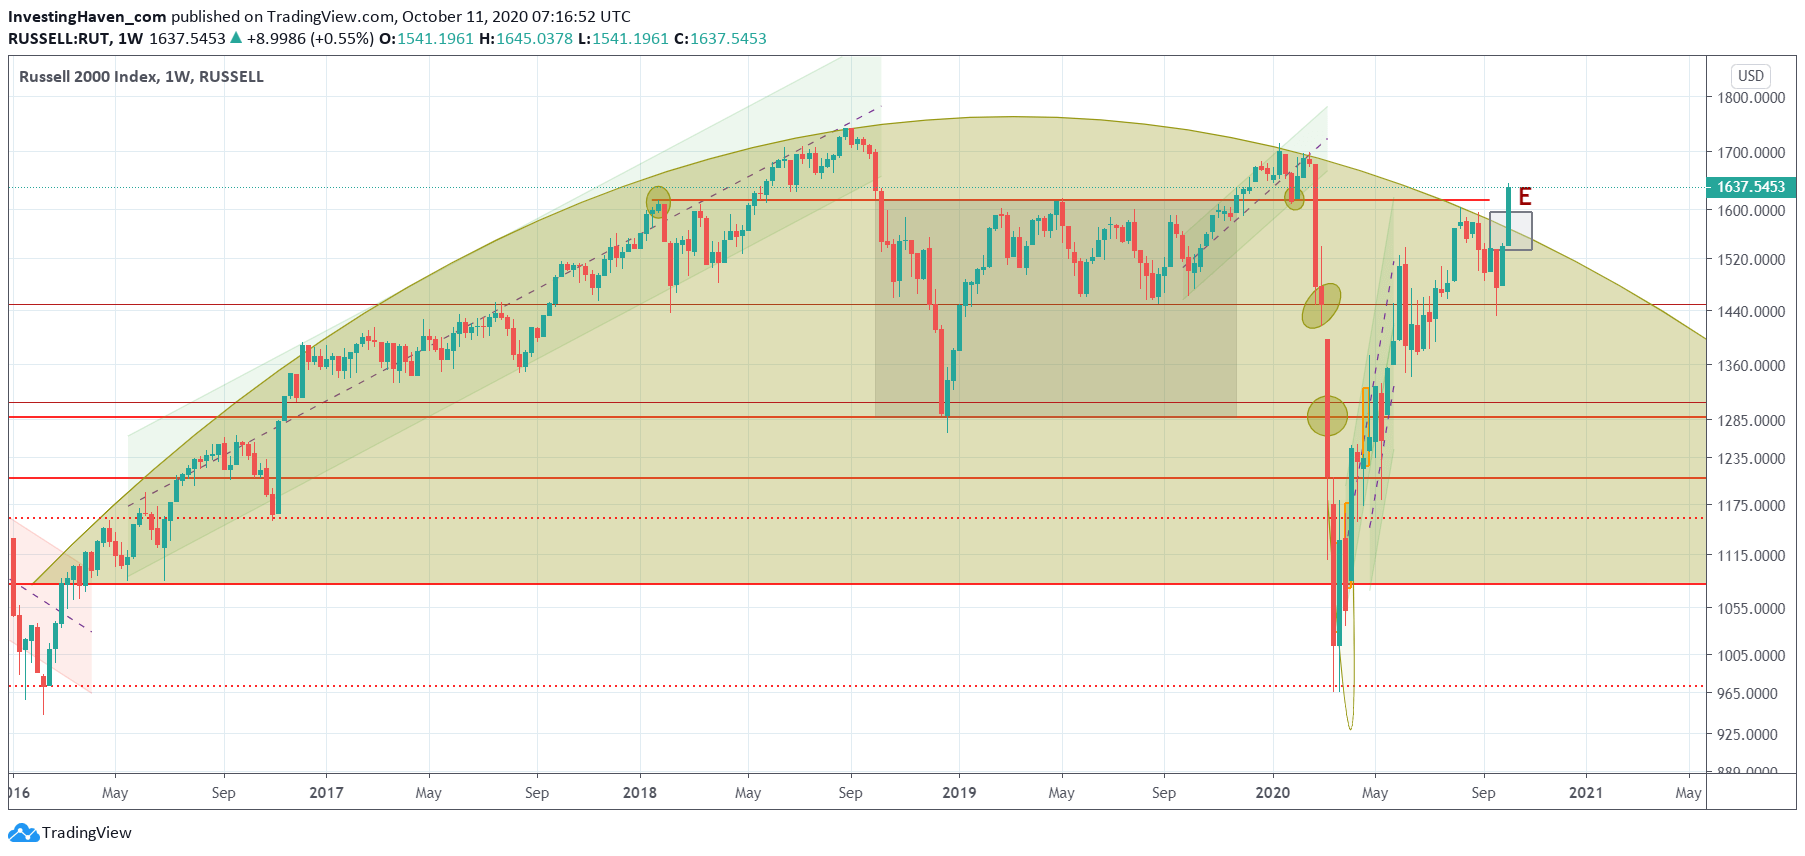
This bodes well for stocks in general. It is worth being and staying invested in stocks, regardless of what you read out there in the news. Ignore the pundits, ignore the perma bears, ignore the number of Corona infections. All worthless for investors, only designed to collect clicks.
What really matters is that the market looks 3 to 6 months ahead in time.
The markets is the driver (leader), the news follows (laggard).
The market is now looking into early 2021 where there is a high expectation of a vaccination and back to normal situation.
That’s what matters, and that’s the message of this chart!
Enjoying our work? We invest in broad stocks in our Momentum Investing portfolio. Also our Trade Alerts premium service plays the S&P 500 in ways that exceed everyone’s expectation. So far, this year, our combined portfolio is delivering +70% year to date. We are on track to double our capital in 2020, as per our Mission 2026.


