This week’s global market sell-off was aggressive and came quite unexpected. We said on Friday that we do not believe the stock market crash of 2018 is underway as currency and credit markets do not show signs of stress. Moreover, we continue to believe that this epic market event The End Of 40-Year Bull Market In Bonds is likely going to unleash huge capital flows into risk assets. We might be wrong, and this week’s stock market should be watched closely to understand if the bond market capital will flow to safe havens vs. risk assets. There is one chart particularly that should be watched closely, it shows a first sign of concern!
The chart we are talking about is certainly not the Dow Jones Long Term Chart on 20 Years. The chart of the Dow did not create real damage on its long term trends. It only created weakness on the short and medium term trend.
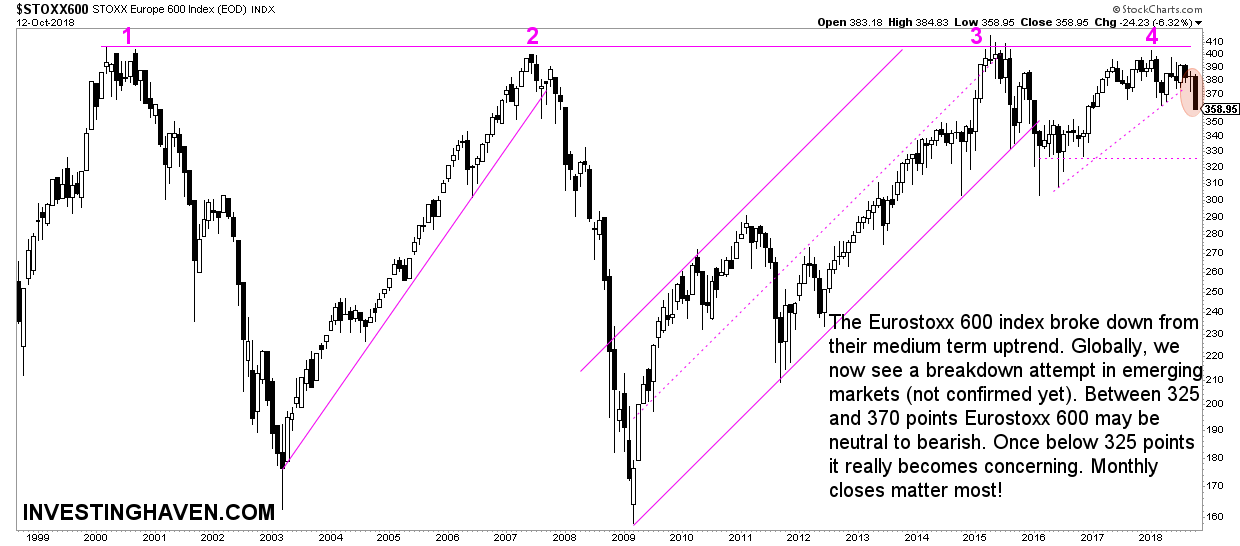
This One Chart Sends A Concerning Signal: Eurostoxx
However, this one chart that sends a concerning signal is the European stock market chart: STOXX 600.
Below is the long term, monthly Eurostoxx chart representing the 600 largest European stocks trading on the European exchange. The decline of this week resulted in a breakdown.
This is a break of the medium term trend, say the uptrend that started in the summer of 2016. This is not catastrophic yet, but it is a clear warning signal, without any doubt.
Things will become very concerning once the STOXX 600 falls below the 310 – 325 level.
Eurostoxx and the Euro as leading indicators
Why is this so important? Europe is not known to be the leading indicator for the rest of world, is it?
Yes and no.
On the one hand the Euro is the most important currency as a global leading indicator, believe it or not. It is more powerful in its chart setup than the Dollar or even Yields.
So far the Euro is not signaling a major market pivot point ahead. That may change though, and it would become remarkable once it does so in tandem with the STOXX 600.
On the other hand right now it is emerging markets that are testing their secular breakout level. A first breakdown attempt is visible though we watch the monthly close to get a confirmation. If Europe and the U.S. remain firm then we tend to believe that emerging markets will recover. However if Europe breaks down, below 310-325 points, we are likely to see a global market sell-off, and the U.S. will follow.
In other words Europe can make a difference, in both directions.
Of course there is this neutral scenario in which global stock markets remain range bound for a couple of months. In that scenario STOXX 600 would trade between 300 and 370 points.
Smart investors watch closely what the Euro as well as the Eurostoxx index do in the next few weeks and months.