
The US Dollar price is still attempting to break out to the upside. At the time of writing it is trading at $105.08. We have mentioned recently that the $105 price level is an important level to watch. Is that price level still relevant? Did the US Dollar breakout today? What to expect moving forward? Those are the questions we will cover in this mid-week US Dollar price update.
The US Dollar Price Performance So Far
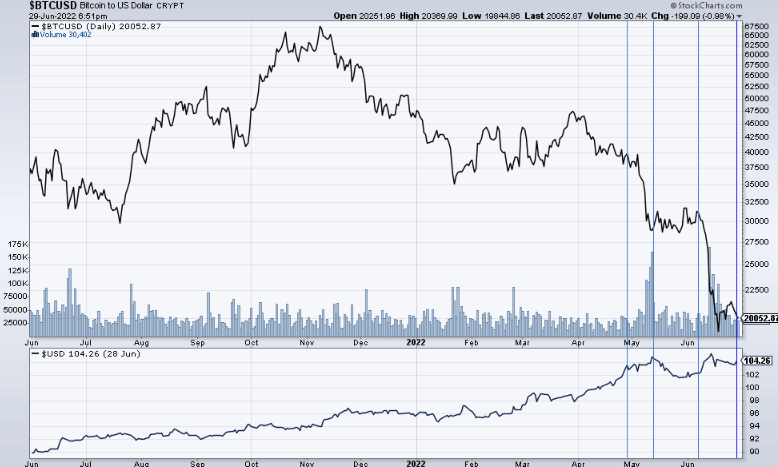
When we look at the US Dollar price performance, it is important to remember the major role the US Dollar plays in intermarket dynamics. We are seeing it first hand when we look at Bitcoin’s price chart, Gold and Silver amongst other assets.
As an illustration of this intermarket effect, we include the daily chart showing the correlation between $BTC and the $USD. We can see how every bounce in the US dollar is met with a sharp decline in Bitcoin’s price.
On June the 17th, we published how the US Dollar could be printing a major reversal at these levels. On the same day, we had what looked like a major reversal candle (Red body, long wick at the top) morph into what looks like an indecision candle instead. The final candle shows that the bears pushed the price down, the bulls pushed the price up and we ended the week with indecision in the market.

That weekly candle remains an important candle for investors to watch. We had a high of $105.78 that day and there is no breakout in the US Dollar until we see the price cross and close above that price level. You can find the US Dollar update covering that week here.
The very long term chart below confirms that we are in a resistance area in the US Dollar price chart. We also see that the trend so far remains sideways and the chart actually looks congested.
A typical congested chart indicates that the demand for the asset is met with a similar supply level so the price continues sideways. So far this remains the case for the US Dollar.

When we zoom in to see specific price levels, We have our initial $105 that remains a level of interest. But we also want to keep an eye on the weekly high for the week ending on June the 17th. That combination gives us an area to watch between $105 and $105.78. A weekly close above will lead to scenario 2 from our US Dollar price roadmap.
Watching a specific price level but keeping an eye on areas of interests is key to success in trading. As someone once told me, trading is an art not a science. You have to be flexible, open minded and go with the flow. A flow that could change things within a couple hours as we saw on the week of June the 17.

Stay informed with more thorough updates from our Momentum Investing Team.
Written by hdcharting, reviewed by Taki Tsaklanos


