The bullish power that we observe in this market is really strong. The two crash indicators that we closely track are in the process of giving up. In this article we look at one of those two indicators: the USD. The other crash indicator is analyzed in Breaking News: Crash Indicator VIX Started An Epic Breakdown. We flagged the USD as the ‘watchout chart’ for February. Although it still needs to be watched closely, it is clear that the USD was not able to create any harm whatsoever. From ‘watchout chart’ to ‘lame duck chart’ in two weeks, pretty impressive, the bulls are really doing a good job pushing stock markets higher. And our bullish stock Dow prediction is only about to turn an even more bullish 2021 forecast.
This is what we wrote 2 weeks ago on the USD chart:
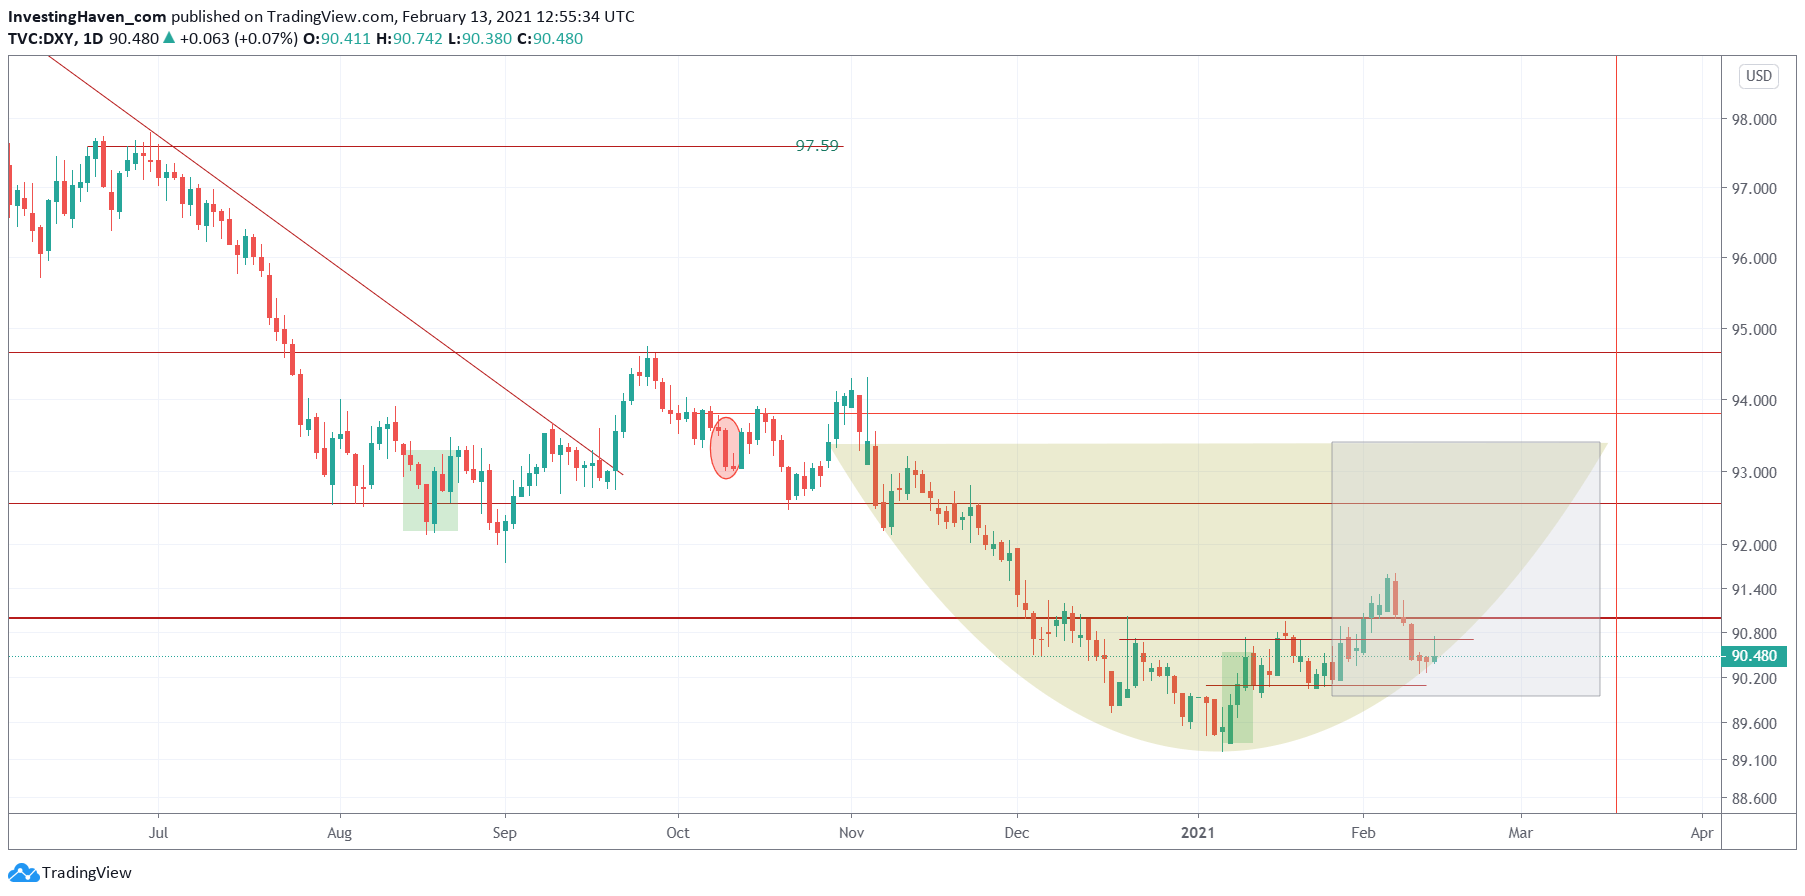
Needless to say, the bullish reversal of the USD is only getting stronger. And what’s intersting, not visible on this version of the chart, is that we noticed a very powerful trendline on the medium to long term timeframe.
Once the USD crosses 91 points on a daily open and closing basis it will be the ultimate confirmation of a bearish bias that will bring good volatility in February.
And this is what we wrote last week on the USD chart:
This chart is turning more bullish. However, we can’t ignore that stock bulls took over control last week, and whatever is bullish in the USD chart did not have any effect whatsoever.
For now, we believe that the USD needs a little bit more time to create any harm to markets. Stock bulls in control, undeniably, until proven otherwise. And a 30% market crash is not what we read in this chart.
It is interesting to notice the evolution of this chart week-over-week: from very powerful and ready to create havoc to stock markets, to mildly bullish to neutral.
We would conclude that this chart is not going to create harm in the short run, on the contrary. Ultimately, it can become bullish in March, but not sooner!
In our Momentum Investing portfolio we turned our protective stance into a much more aggressive stance over the last 2 weeks, as we saw the bearish power in our 2 leading crash indicators fade week-over-week. That’s how we structurally manage our portfolio with cash positions vs aggressive/defensive stock positions, a very structured methodology based on advanced charting and intermarket analysis. In our Trade Alerts portfolio we now have a bullish position on the S&P 500 which looks promising.