
Yields are crucial. They have a leading role, as they tend to influence other markets. Anyone who uses any form of intermarket analysis to understand where stocks and commodities are going is including Yields, one or another, in its methodology. So do we as try to forecast market trends. We take a look at Yields in the medium to (very) long term, and try to understand what we can learn from it especially as it relates to 2021 market forecasts.
Before looking at the charts we want to emphasize the importance of Yields (credit markets). As per our 100 investing tips
All major moves in markets, especially market crashes, start with major turning points in credit and currency markets. That’s why 10 and 20 year rates, as well as leading currency pairs, have the most influence on all other markets, including stock markets around the globe.
In this post we focus on 10 year Treasury Yields (TNX).
Although we typically take a top-down approach, from monthly to weekly to daily charts, we will reverse the approach today. It will become clear why we do so.
Yields and intermarket analysis
Rising Yields suggests that investors are exiting Treasuries, and the price of Treasuries comes down. This suggests that investors have a preference for risk assets, as capital flowing out of Treasuries finds its way to stocks, commodities … crypto presumably as well.
We can include different maturities (30 yr, 20 yr, … 1 yr) in our analysis but we believe in that ‘keeping things simple’ is what we should try to do. “Everything should be made as simple as possible, but no simpler.”
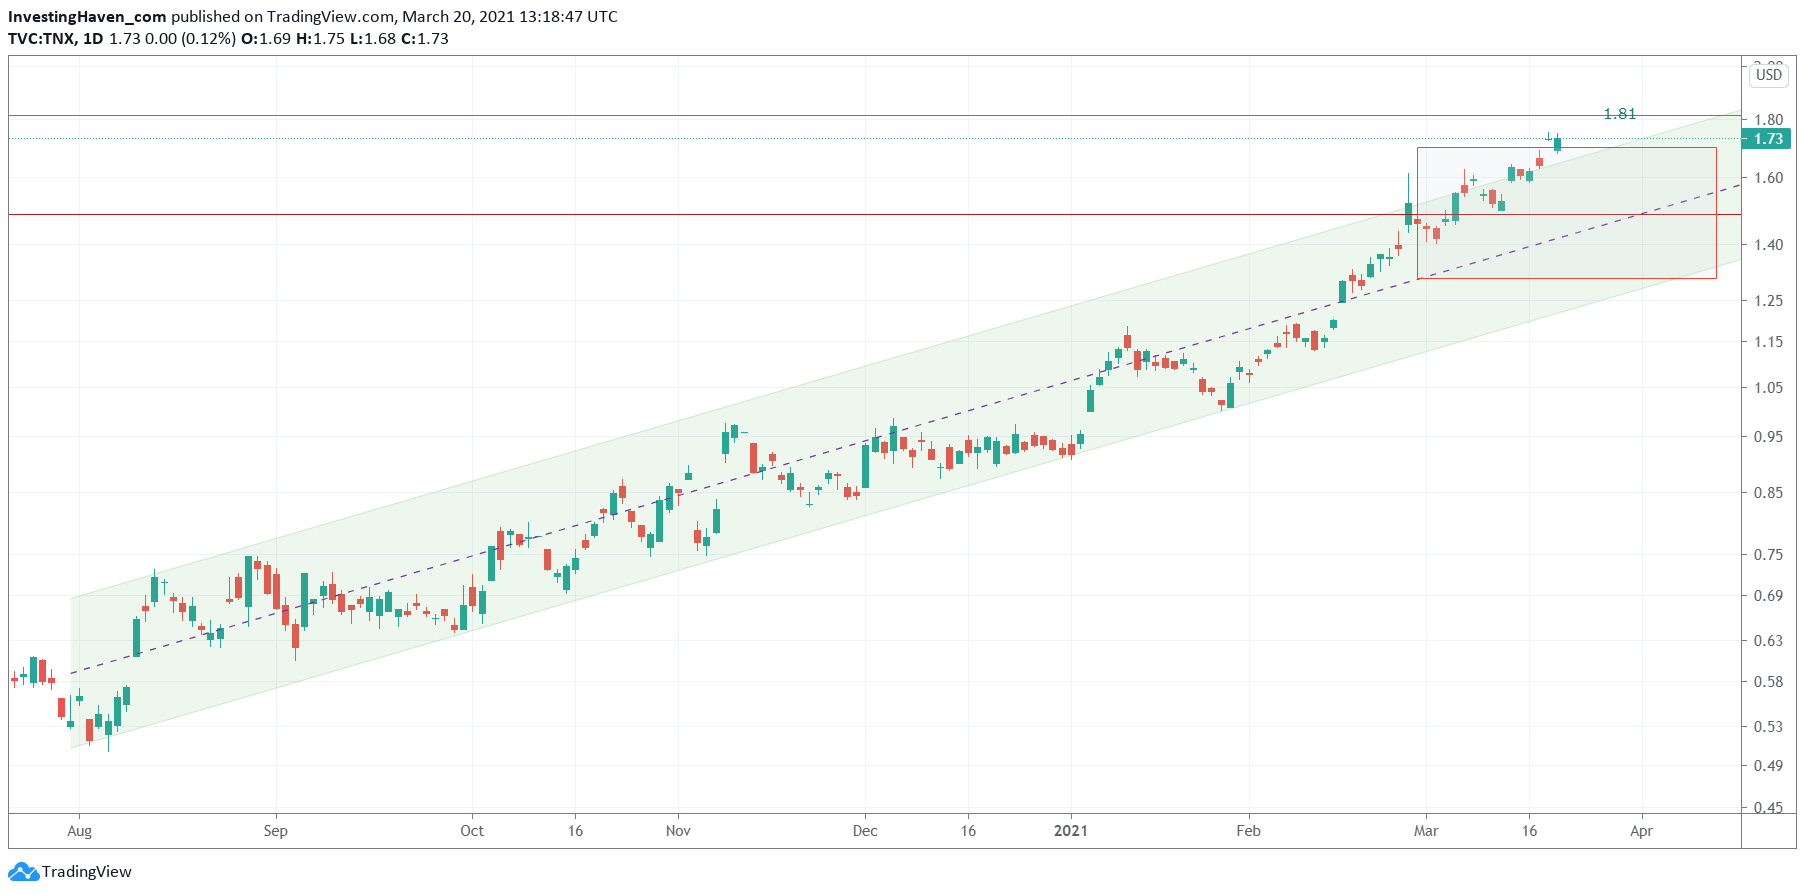
Daily TNX chart
The trend on the daily chart is crystal clear. Since August of 2020 the trend is up, and did accelerate since early February. TNX is even moving outside of its rising channel, or at least it’s trying to.
Pay special attention to the 2 red trendlines: one around 1.47 and the other one at 1.81. The longer timeframes will reveal why they are important.
Conclusion: The daily chart shows a strong bullish trend.
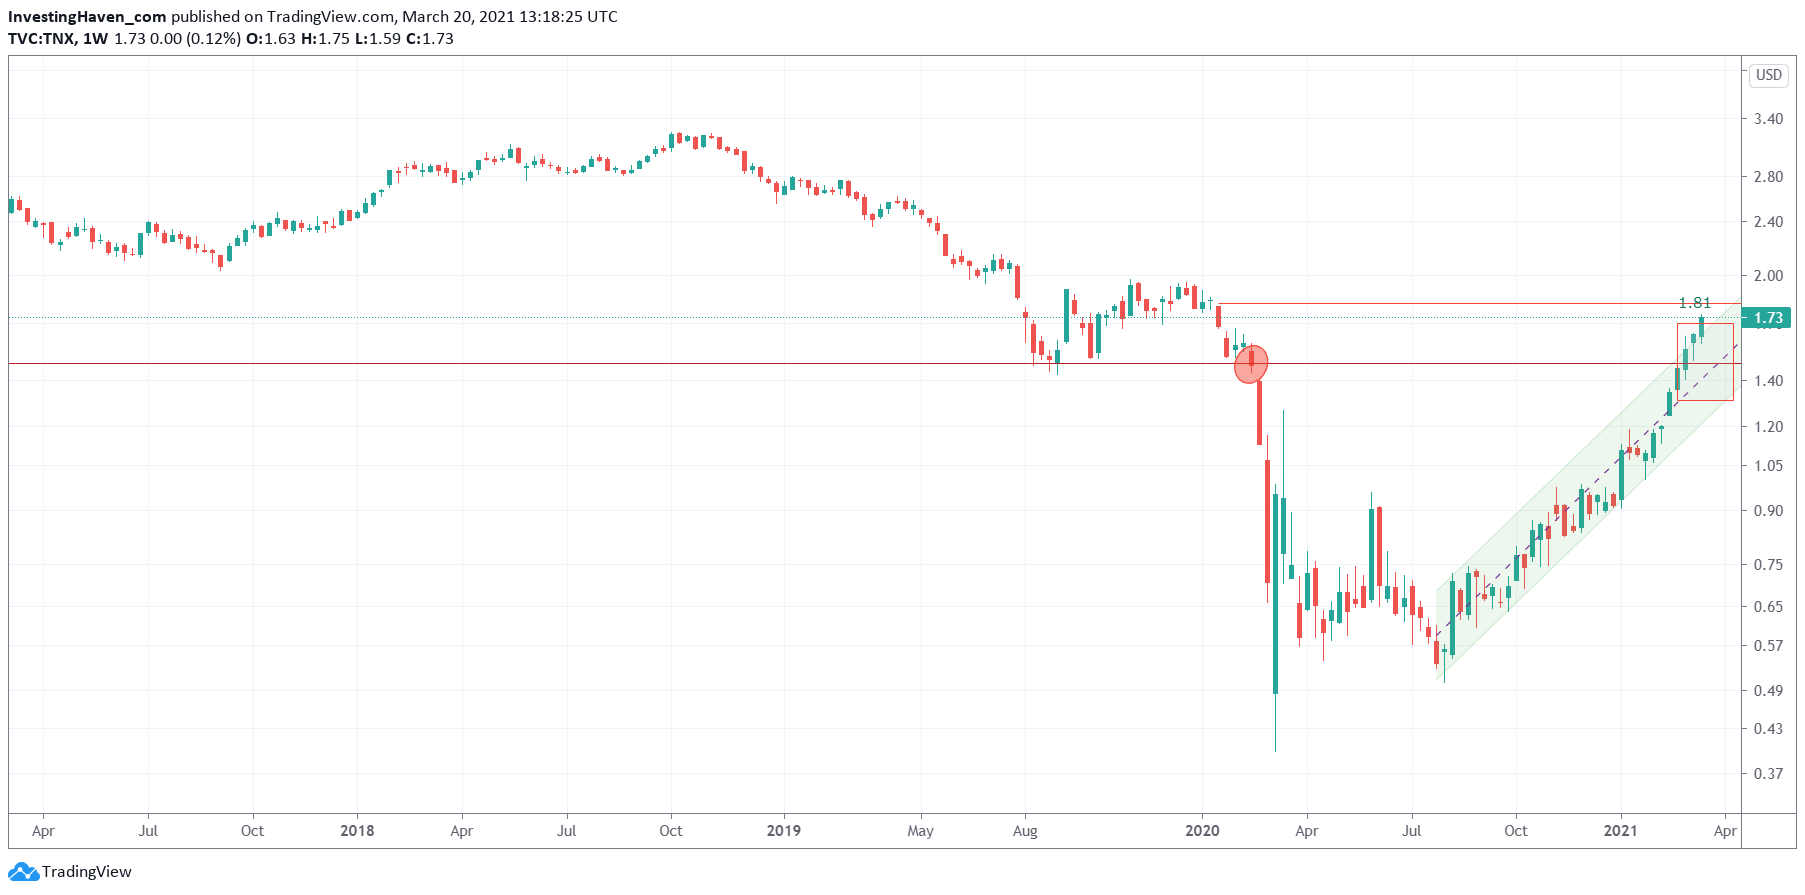
Weekly TNX chart
The weekly chart has this giant bullish reversal over the last 12 months. It’s a W pattern, clearly.
It started with the big breakdown in February of 2020.
It’s on the weekly that we can find the importance of the 2 red trendlines outlined above. And we believe that 1.81 points will provide resistance.
The million dollar question, for global markets and especially US stock markets, is what TNX will do next after hitting 1.81 points.
- Will TNX consolidate between 1.47 and 1.81? If so, great as it will be supportive of stocks.
- Will TNX come down strongly? Not so great for risk assets.
We don’t believe we can have answer to this question at this point in time. We simply need the market to do its work, and show its intention. Not just in TNX, but also in currencies / stock indexes / commodities.
Conclusion: The weekly chart suggests TNX is about to hit resistance, and a consolidation in the 1.47 – 1.81 area is one of the scenarios that might come next.
Monthly TNX chart
The monthly is really impressive. It shows the magnitude of the 2020 sell off, also when compared to the 2008/9 financial crisis (it was a blip back then, in relative terms).
If anything, the most interesting conclusion is that TNX got back above its multi-decade support level (former support) which is 1.47. Remember it was one of the 2 red trendlines on the first chart, and what an important one.
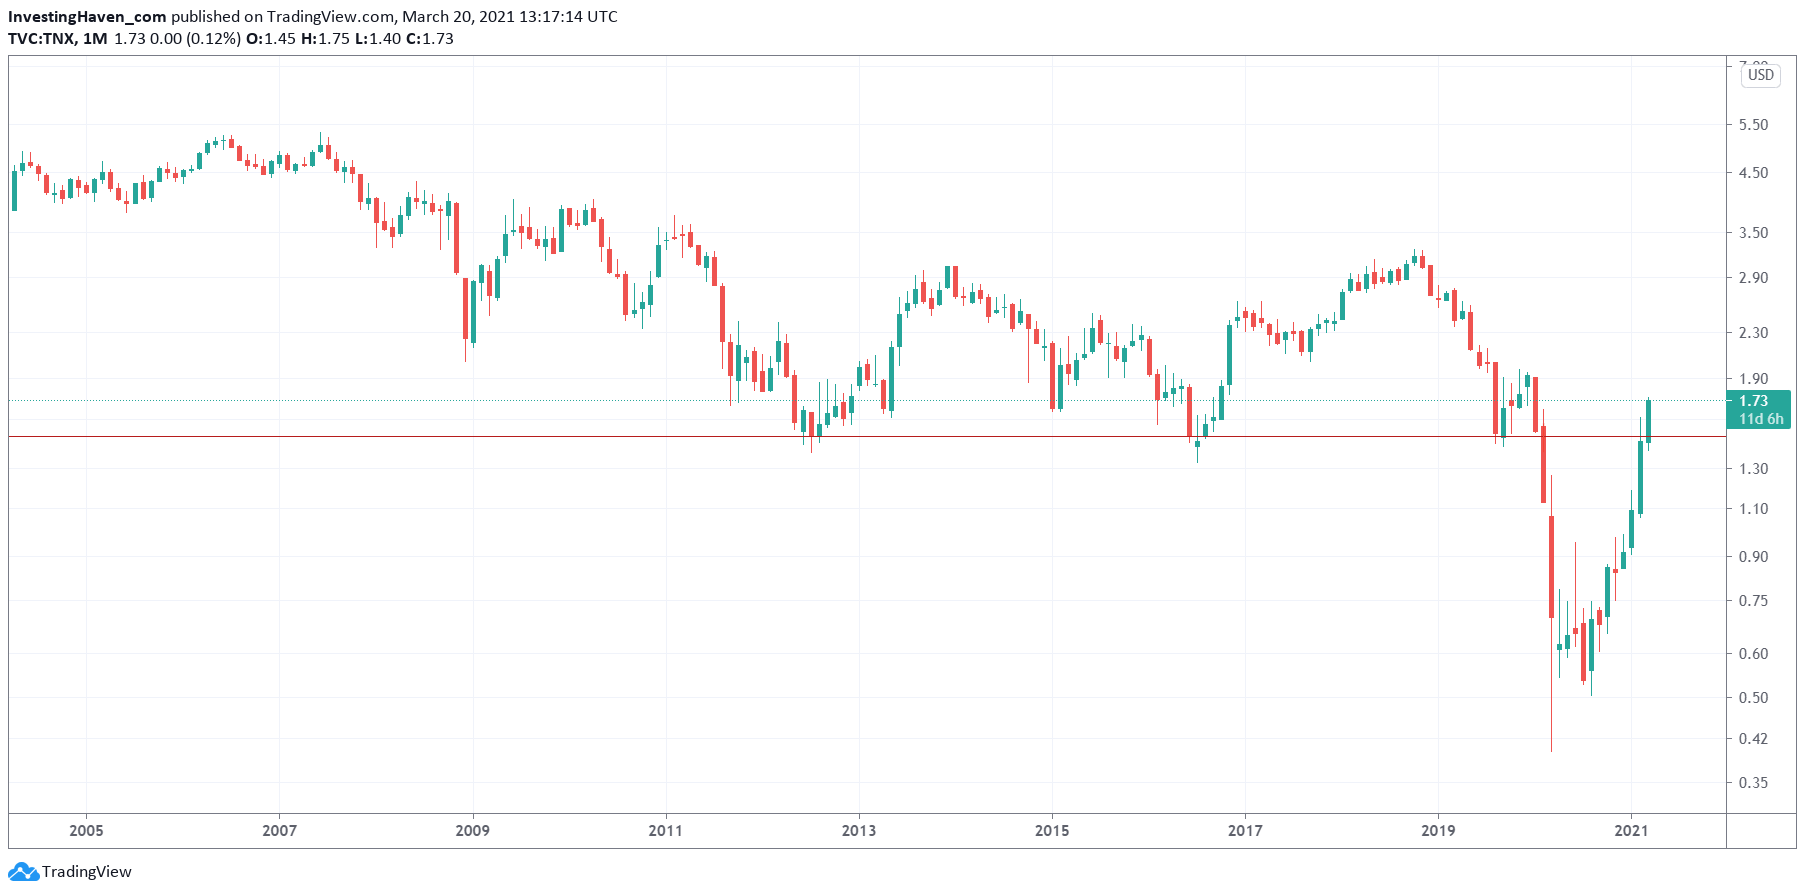
If risk assets will continue to be attractive to investors it should come with TNX readings above 1.47 points.
In other words we’ll be watching closely how TNX is going to behave around 1.47 and 1.81 points, in the next few weeks and months. The trends we will see arise, and how they relate to those 2 levels, is going to be telling for trends in other markets, first and foremost stocks.
Enjoying our work? We invest in broad stocks as wel as commodities in our Momentum Investing portfolio. In our Trade Alerts premium service we focus on SPX trading in the short term. Next to SPX trading we take a few swing trades per year. In 2020 the combined portfolio delivered +93%. Results are tracked in our trade log books, and publicly shared every 6 months on our Mission 2026 page.


