It is very quiet about emerging markets. The actual topics in financial media in the last year were US and European stock markets, the gold market, crude oil, but certainly not emerging markets. The only exception to that was China in 2015, but sure after its collapse.
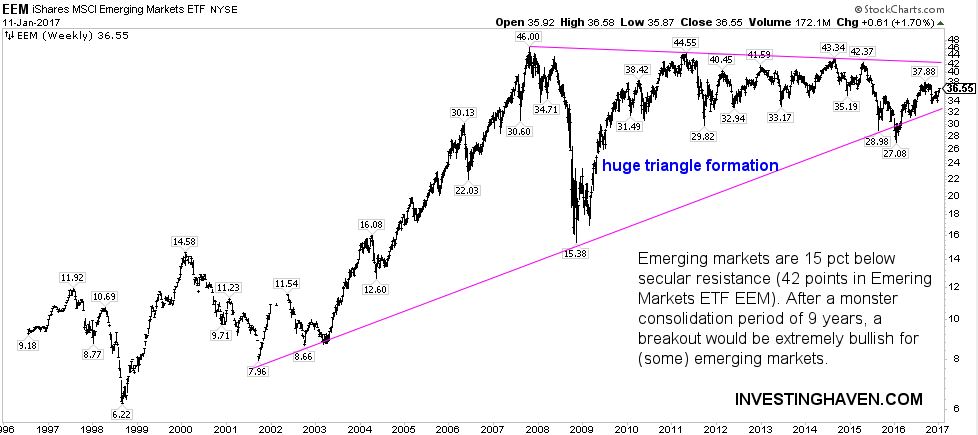
The 20-year chart of emerging markets is definitely one to watch very closely. The most striking conclusion out of this chart is the extremely long consolidation period. Watch how the triangle formation spans over 9 years now. Typically, a lot energy is gathered during such a long time period. The general rule is that the longer the chart formation the stronger the uptrend or downtrend afterwards.
Emerging markets are right now 15 pct below secular resistance which comes in at 42 points in EMM (the best known Emerging Markets ETF). If the 42 level would be broken, potentially in a couple of months, we would see an extremely bullish period for emerging markets.