We said repeatedly in recent months that tension is rising in the gold (GOLD) market. Very recently, we observed momentum and forecasted it was a matter of days (max 2 to 3 weeks) until gold would choose a new trend: Gold – Decision Time After U.S. Fed Rate Hike.
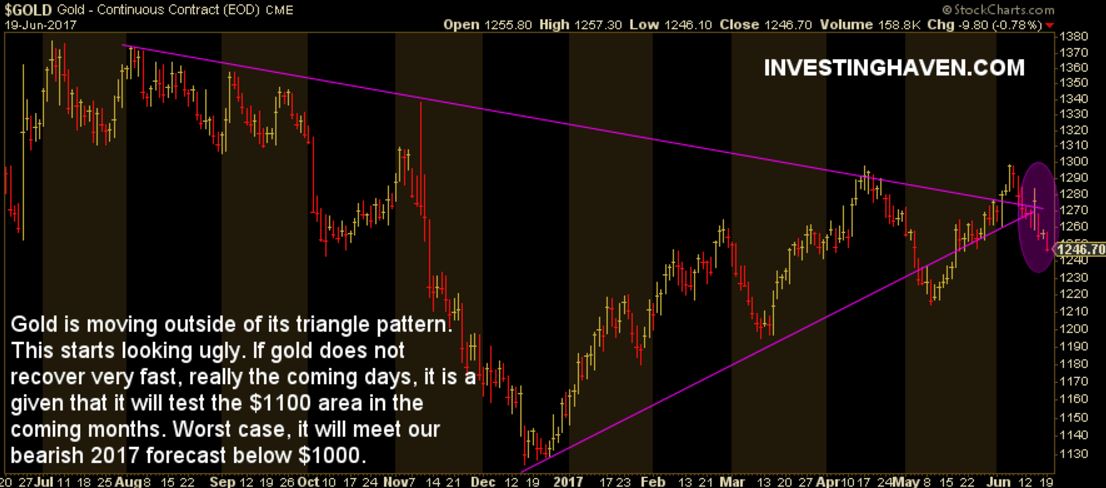
The challenge with the gold price, as well as the silver price and precious metals miners, is that the market moved from false breakout to false breakdown, within the triangle pattern visible on below chart:
- In June, we wrote that the gold price is attempting to breakout and set a bullish trend for 2017.
- In May, we observed that the price of gold could benefit from the dollar breakdown.
- In April, there was a clearly bearish signal in the gold mining space.
As an investor, go figure. Not easy, and we openly admitted that these conditions are extremely hard to forecast.
Still, we sticked to our bearish gold price forecast for 2017, because of the fact that U.S. stocks would continue their ‘risk on’ period until the second half of 2017. As a next step, after U.S. stocks started a tactical or secular ‘risk off’ cycle, we would expect capital to flow to precious metals.
We still believe in that scenario. If that plays out as expected gold and silver will correct in the coming months. That correction could have started last week, as suggested by the gold chart below. It could bring to the $1100 area, and, worst case, below $1000. That would offer an incredible BUY opportunity late this year.
Note on below chart that gold bulls wish that gold recovers as of tomorrow. If gold continues to slide the coming days, until the end of this week, we will see a bearish period unfold until November / December. Smart investors will prepare significant positions in precious meteals for the end of the year.