The price of gold (GOLD) keeps bulls and bears awake. This is exciting as it can be. Gold is one of the most spectacular markets in 2017, as evidenced by the amazing chart setup of the gold price.
Gold peaked last summer, right after the Brexit-vote. It came sharply down after Trump’s victory right at a time when interest rates started rising sharply; both yields and the price of gold are inversely correlated at times when yields move sharply higher or lower.
After bottoming in December last yeaer, gold started rising. In doing so, it created an amazing chart setup, not seen very often.
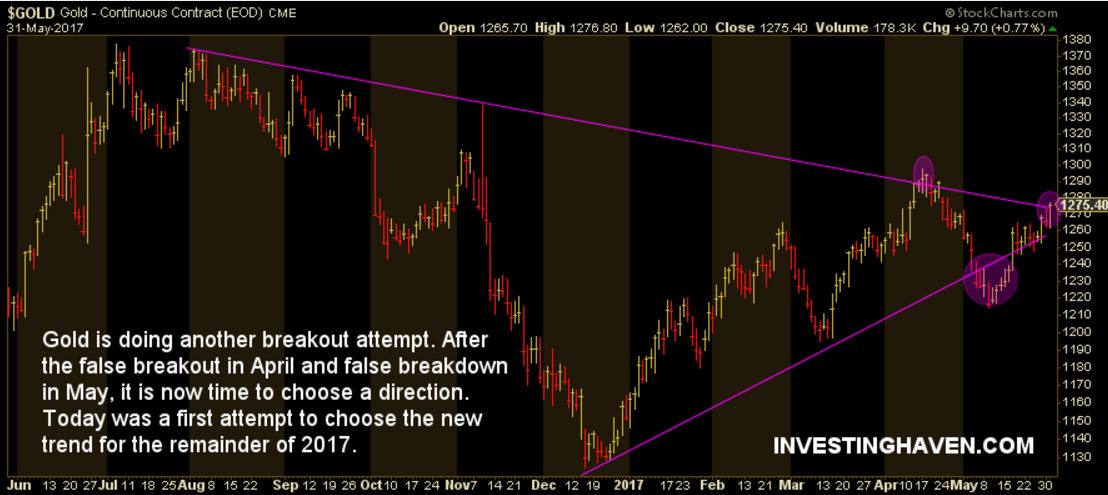
In April, gold attempted to break out of this triangle chart pattern. That proved to be an unsuccessful attempt. In May, gold showed weakness, and started breaking down. We saw that coming based on the bearish price action in gold miners. However, the breakdown was false, as gold recovered sharply mid-May as the U.S. dollar started to break down.
Last week, it became clear that the gold price was about to start a new trend. We said that this week and next week would be the ‘moment of truth’ for gold in 2017.
Right now, as gold is closing today’s trading session, it is attempting (again) to break out. The purple circle on the chart shows the breakout attempt. Once above $1290 per oz, for at least 3 trading days, we can know with a high level of certainty that the breakout was successful. If that will be the case, we will have to revise our Gold Price Forecast For 2017.