Some charts are interesting, but silver’s long term chart definitely falls in the category of incredible charts.
Silver has arrived at an extremely important point. Note the three trendlines on its chart:
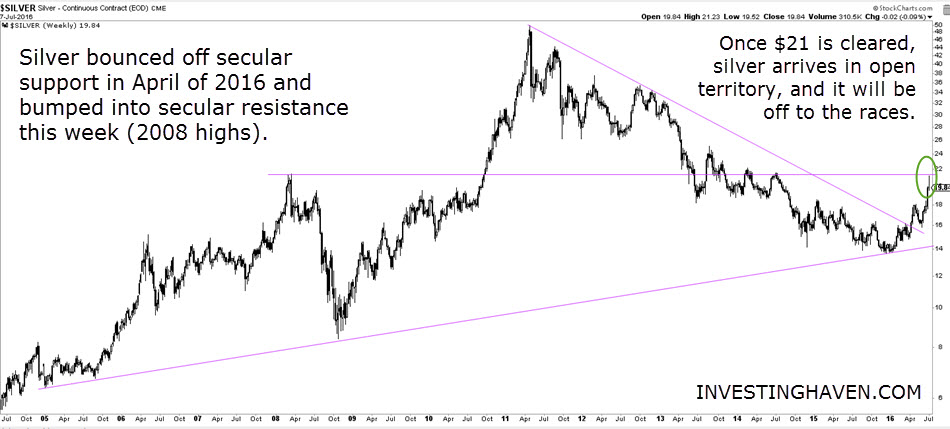
- Secular support did hold as silver bounced off the support line in January of 2016.
- Silver’s bear market trend line was breached in April of this year, indicating something big was brewing.
- Now silver has arrived at secular resistance, i.e. the 2008 highs. This is an incredibly important point. It is no coincidence that silver peaked last Monday exactly at that point as indicated with the green circle on the chart.
If silver will be able to clear $21, and close for at least 5 consecutive days above it, then silver is off to the races, as it arrives in an open space with resistance around $28.