The silver price is about to test for the 7th time its bear market trend. Silver’s chart setup is simply amazing. This is a perfect case of how important a decent chart analysis is for investors.
Many investors fail to understand the value of chart analysis. In doing so, many mix up chart analysis with technical analysis. InvestingHaven’s research team is not focused on technical analysis, but on chart analysis. That is a big difference, as chart analysis looks at the trends in prices (combined with trading volume, if relevant). So present prices are the leading indicator. In technical analysis, past prices are important, as they form technical indicators.
Financial Times, for instance, said a month ago that the 50-day moving average of the silver price was about to break above its 200-day moving average. “That is a phenomenon known as a “golden cross” and is often considered a harbinger of further bullish momentum.” Since then, however, there was no breakout in the price of silver.
When analyzing silver’s price chart, a couple of observations stand out:
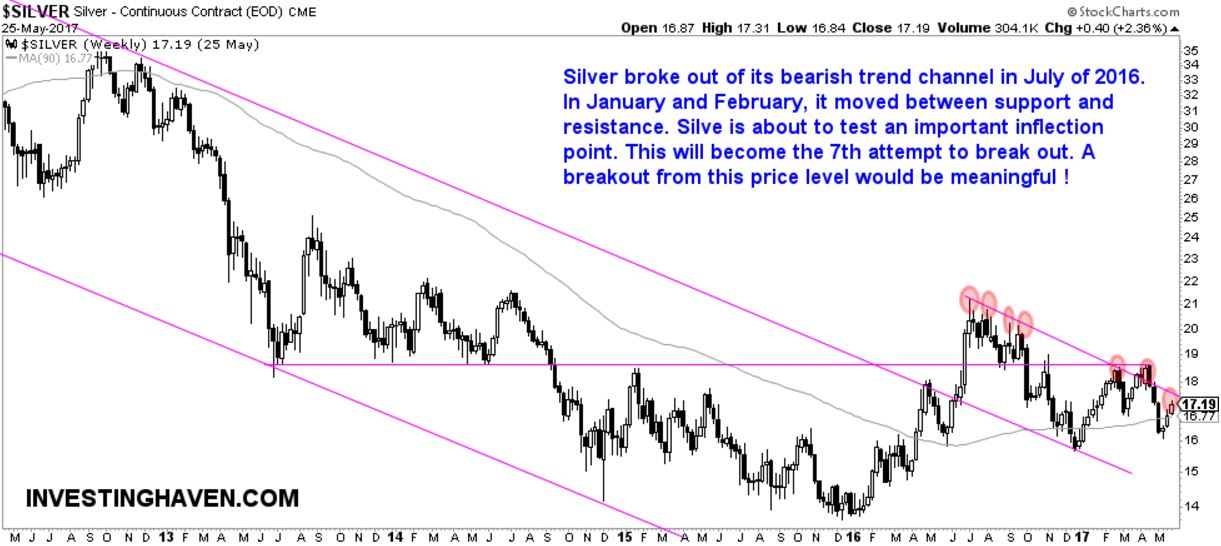
- The bear market in silver, which started in 2011, is still intact.
- In July of 2016, the bear market was broken to the upside. That resulted in a parallel channel which confused both bulls and bears. It has a bullish look, but it remains bearish as every new high is lower than its previous high.
- There have been 6 attempts so far to break through this new, ‘parallel’ trend channel.
- Silver is clearly stronger than gold since last year.
So far, our Silver Price Forecast For 2017 remains intact.
However, if this 7th attempt to break out will materialize, then it will be a mega-breakout. We will have to revise our silver price prediction. The opposite is true as well: a failure to break out would suggest that the lower part of the channel will be tested later this year.
The silver market will soon show whether our silver price prediction which was featured on MarketWatch will come true or not.