2016 is certainly the year where markets are behaving in an extreme fashion. Most recently, we have witnessed a mini-flash crash post-Brexit with a sharp V-shaped recovery, just in one week.
Our risk indicators have arrived at extreme levels. We pick out 4 fundamental risk indicators from our methodology which we discuss in this article. Apart from extreme readings our risk indicators also show an important divergence. In other words, markets arrived at a critical juncture and are ready to accelerate in the same direction or reverse their course.
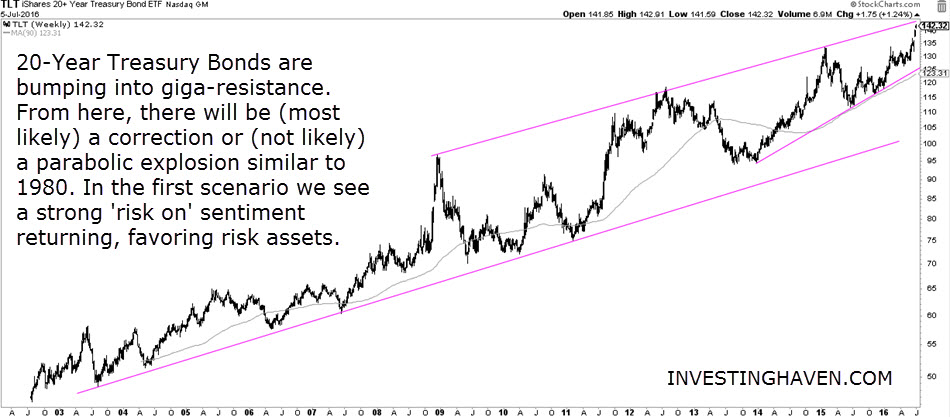
First, 20-year Treasuries arrived at secular resistance, see the upper area of the secular trend channel on below chart. High bond prices imply a flight to safety. From here, we see two scenarios unfolding (1) a parabolic rise outside the trend channel similar to 1980 or (2) a sharp correction. The latter scenario is the most likely one, and that would open the door to risk taking, i.e. a flight to broad stock markets.
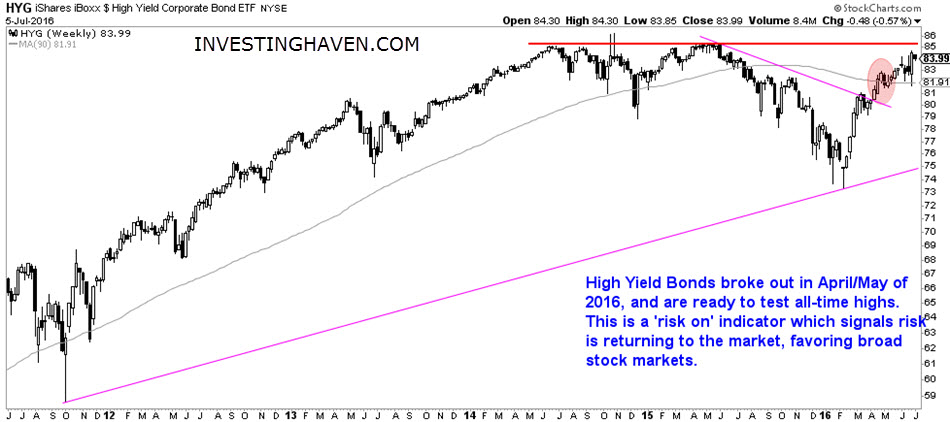
Second, high yield corporate bonds (HYG), which stand for risk taking, are testing all-time highs. HYG broke out in April/May of this year. Right at a time when investors for safe havens (20-year Treasuries at all-time highs), we also observe HYG testing all-time highs. That is extremely odd, and certainly an important divergence to take into account. Investors are both concerned but also ready to take risk.
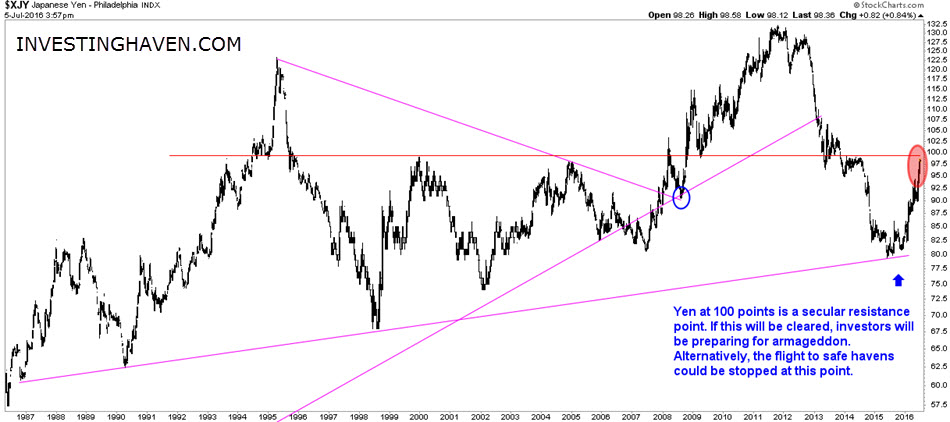
The Japanese Yen is confirming the view in 20-Year treasuries. The Yen made a spectacular rally in 2016, confirming the flight to safety. However, it has also arrived at a huge resistance area, going back many decades, i.e. 100 points. This risk indicator seems really stretched, and we cannot imagine a continuation of this powerful rally. The odds favor a correction.
It is worth watching how stock indexes and the HYG indicator react as both the Yen and 20-Year treasuries test secular resistance.
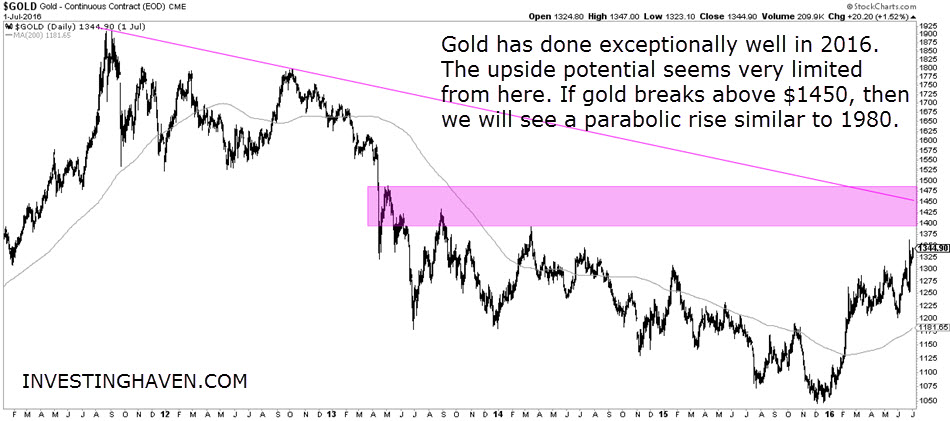
Last but not least, gold is another exceptional performer in 2016. This safe haven metal made a spectacular U-turn this year. According to our methodology, it confirmed a new bull market since yesterday (read why June 2016 was such an important month for gold). Although gold is not as stretched as Treasuries and the Yen, it is close to bumping into huge resistance. Note on the chart how $1450 is a trendline connecting its all-time highs with the peak of 2012 (right before the big collapse took place). Similarly, the $1390 to $1470 area provide exceptional resistance.
CONCLUSION: Though safe haven assets have enjoyed a spectacular run in 2016, it seems that they arrived at huge resistance, all of them at the same time (just gold seems to have a little bit of upside potential, though limited).
The most likely scenario is that high risk corporate bonds (representing risk in the market) which are now testing all-time highs will break out as safe haven assets correct from their extreme readings. In that scenario stocks will outperform all other assets in the second half of 2016.
The unlikely scenario is that safe haven assets go parabolic (literally) and we get a scenario similar to 1980.


